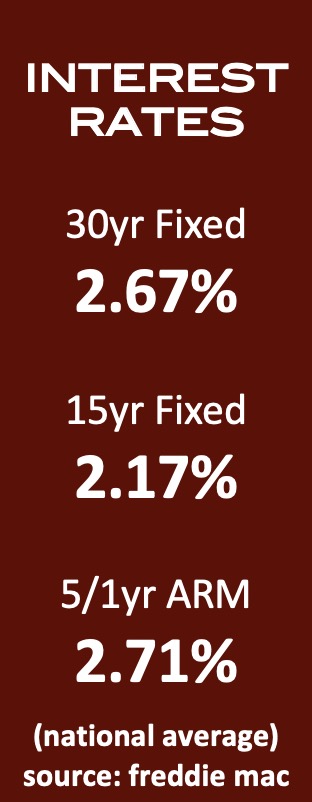
The real estate market in Fairfield ended 2020 noticeably stronger than it started. Although the median sales price for single family homes was down 4.22% from November’s high, overall, the price ended higher than it started in January. Compared to 2019, home values saw a 15.38% increase in 2020. Fairfield ended the year in a sellers-market, with 4.9 months of inventory. That shift came by July, ending a long buyers-market for most of 2018 and 2019. Pandemic driven sales helped drive up demand as Fairfield and most towns saw an increase in out of state buyers. Days on market were also low for the year, around 59 days for 2020 vs. 72 days for 2019, so houses were selling considerably quicker, with steep competition among buyers. Pandemic buying was strengthened by historically low interest rates. The 30yr fixed rate started the year at 4.51% and ended at 2.67%. This was a win-fall for buyers and many homeowners who were able to refinance their higher rates, shortening their loan and saving hundreds of dollars in monthly interest moving forward. Although some reports suggest a slowdown of the urban exodus, inventory is still lower than demand and millennial buyers are expected to keep future sales strong. This is still a great time to sell. Do you know anyone looking for more information about their real estate market? I’d be happy to help.
12 Month Sales Activity

Housing Stats
(change from previous month)
| Median Sale Price: | $737,500 |
| change: | -4.22% |
| YTD change: | 15.41% |
| Units Sold: | 88 |
| change: | 12.82% |
| Active Listings: | 191 |
| change: | -23.60% |
| New Listings: | 49 |
| change: | -35.53% |
| Days on Market: | 47 |
| change: | 11.90% |
| Months of Supply: | 4.90 (Stable Market) |
| change: | 25.64% |
2020 Local Real Estate Price Trends:
2020 turned out to be a stellar year for home value growth, which increased dramatically in nearly every town. The three big factors driving home prices for the year were pandemic driven buyers, historically low interest rates and an unusually low inventory of houses. Surprisingly, historic unemployment rates did not stop the surge in demand for CT houses. Even with 2020’s spectacular gains however, only Westport, Milford and Fairfield have seen home values return to levels prior to the great recession of 2009.
| 2019 | 2020 | Change | |
| Bethel | $345,000 | $388,750 | 12.68% |
| Bridgeport | $206,150 | $245,000 | 18.85% |
| Easton | $562,500 | $586,250 | 4.22% |
| Fairfield | $585,000 | $675,000 | 15.38% |
| Milford | $307,250 | $350,000 | 13.91% |
| Monroe | $367,500 | $425,000 | 15.65% |
| Newtown | $380,000 | $430,000 | 13.16% |
| Norwalk | $485,128 | $539,500 | 11.21% |
| Orange | $378,000 | $395,000 | 4.50% |
| Redding | $525,000 | $567,500 | 8.10% |
| Ridgefield | $628,250 | $700,000 | 11.42% |
| Shelton | $339,450 | $379,000 | 11.65% |
| Stratford | $250,000 | $299,900 | 19.96% |
| Trumbull | $385,000 | $430,000 | 11.69% |
| Weston | $685,000 | $819,000 | 19.56% |
| Westport | $1,125,000 | $1,355,499 | 20.49% |
| Wilton | $690,000 | $810,000 | 17.39% |
Gen X, Millennials Likely to Keep Home Buying Strong for Years to Come:
Between 2018 and 2028, the number of households is projected to increase by up to 12 million. Generation X and millennials are expected to drive most of that household formation. As they replace dropped households over that time, the two generations could add nearly 25 million new households by 2028, according to the CoreLogic Insights Blog.
The largest cohort of millennial buyers have yet to surface on the market, researchers note. That segment, from ages 28 to 30, numbers nearly 15 million and is approaching the average age to buy a first home, 33 years old, CoreLogic reports.
Even as younger generations wait to enter the housing market in high numbers, the market already faces a home inventory shortage. The number of homes for sale has reached the lowest level on record. That has prompted home prices to increase faster than incomes. Over the past two decades, home prices have increased by 1.6 times the rate of real household incomes, CoreLogic says.
Record low mortgage rates over the past few months have helped to offset high prices. Still, first-time home buyers are facing increasing affordability woes as they try to come up with a down payment. While the monthly mortgage payment and insurance have dropped by 3% compared to a year ago, the down payment needed is up 8% (from about $20,000 to about $22,000 for a median-priced home at $225,000), according to CoreLogic.
“This may be a daunting challenge for some particularly given that the median financial asset holding of families headed by a person under 35 years of age is only about $8,500,”
Exodus To The Suburbs Appears To Be Reversing:
The latest housing data shows consumers returning to urban areas after abandoning cities for the suburbs in the early days of the COVID-19 pandemic. In places such as New York, San Francisco, Chicago, and Boston, some rental buildings went from full occupancy to 50% vacant as remote work and school enabled residents to move to less congested areas.
But now there are signs of a reversal of that trend.
The Greater Boston Association of REALTORS® reports that sales of single-family homes and condos in the city were at their highest levels on record in October. In Chicago, home sales surged 39% the same month compared to a year ago, according to the Illinois Association of REALTORS®. In New York, single-family home sales jumped 34% from September to October.
But the appeal of big cities likely will return as the coronavirus vaccine rollout escalates, real estate experts predict. “I expect the big-city market to stay hot for a more gestalt reason: because city dwellers are city people,” Ryan Serhant, writes for Forbes.com. “City dwellers aren’t the type who want to live in rural areas, have only one or two local restaurants to choose from, and lose the electric energy that makes our cities such special places to be. Collectively, we are all looking ahead and looking forward to a return to pre-pandemic life.”With the pandemic, homeowners are seeking more privacy and security. The demand for fences has driven up prices. Since the begining of 2020, the price for pressure treated wood as more than doubled.
Fairfield Sales Trends: January-December

December Single-Family Home Sales
(OLP: original list price • LP: list price • SP: sale price • DOM: days on market)
| Address | Style | sq ft | BR | BA (f/h) | OLP | LP | SP | SP/OLP | DOM |
| 12 Meadowbrook Rd | Cape Cod, Half Duplex | 894 | 2 | 1/0 | $264,000 | $264,000 | $245,000 | 93% | 76 |
| 66 Elvira Ln | Colonial | 4,572 | 4 | 3/1 | $825,000 | $749,000 | $730,000 | 88% | 237 |
| 909 Church Hill Rd | Colonial | 4,353 | 5 | 4/0 | $774,900 | $774,900 | $745,000 | 96% | 91 |
| 2525 Hillside Rd | Colonial | 2,878 | 4 | 2/1 | $729,000 | $729,000 | $753,000 | 103% | 17 |
| 53 Round Hill Dr | Colonial | 3,700 | 4 | 2/1 | $1,099,500 | $1,099,500 | $1,020,000 | 93% | 47 |
| 319 Harbor Rd | Other | 3,580 | 5 | 5/0 | $3,495,000 | $2,998,000 | $2,280,000 | 65% | 861 |
| 2273 Easton Tpke | Cape Cod | 1,075 | 3 | 1/0 | $339,000 | $330,000 | $329,500 | 97% | 181 |
| 272 Knollwood Dr | Cape Cod | 1,749 | 3 | 1/1 | $568,500 | $539,500 | $517,500 | 91% | 64 |
| 1160 S. Pine Creek Rd | Contemporary | 2,891 | 3 | 2/1 | $929,000 | $929,000 | $850,000 | 91% | 29 |
| 336 Jackman Ave | Colonial, Bungalow | 1928 | 3 | 2/1 | $599,000 | $599,000 | $600,000 | 100% | 29 |
| 65 New St | Cape Cod | 2,602 | 3 | 2/1 | $619,000 | $619,000 | $636,000 | 103% | 44 |
| 54 Cardinal St | Colonial | 2688 | 4 | 2/1 | $575,000 | $550,000 | $546,000 | 95% | 43 |
| 152 Ruane St | Split Level | 1,243 | 4 | 1/0 | $410,000 | $399,900 | $385,000 | 94% | 34 |
| 72 Ferncliff Rd | Ranch | 1,935 | 4 | 2/0 | $425,000 | $425,000 | $441,000 | 104% | 16 |
| 141 Wilton Rd | Cape Cod | 1,303 | 4 | 2/0 | $469,000 | $459,000 | $475,000 | 101% | 77 |
| 137 Woods End Rd | Cape Cod | 1906 | 3 | 2/0 | $525,000 | $525,000 | $535,000 | 102% | 42 |
| 135 Alden St | Colonial | 1,768 | 3 | 2/0 | $649,000 | $599,000 | $620,000 | 96% | 51 |
| 273 Bulkley Dr | Colonial, Split Level | 4,642 | 4 | 5/0 | $819,900 | $819,900 | $810,000 | 99% | 53 |
| 1516 Cross Hwy | Colonial | 5,941 | 5 | 4/2 | $1,498,000 | $1,498,000 | $1,500,000 | 100% | 69 |
| 1028 Pequot Ave | Colonial | 4,262 | 5 | 4/1 | $2,595,000 | $2,595,000 | $2,625,000 | 101% | 18 |
| 395 Woodridge Ave | Cape Cod | 1,722 | 4 | 2/0 | $554,900 | $554,900 | $585,000 | 105% | 25 |
| 1341 Redding Rd | Colonial, Chateau | 4,932 | 5 | 2/2 | $1,365,000 | $1,365,000 | $1,370,000 | 100% | 37 |
| 128 Sky Top Dr | Ranch | 1,923 | 3 | 2/1 | $650,000 | $650,000 | $650,000 | 100% | 16 |
| 206 Catamount Rd | Barn | 3,920 | 3 | 2/1 | $789,000 | $739,000 | $690,000 | 87% | 227 |
| 229 Lakeside Dr | Colonial, Ranch | 3,000 | 3 | 4/0 | $850,000 | $799,000 | $775,000 | 91% | 92 |
| 3473 Redding Rd | Ranch | 2,986 | 4 | 3/0 | $769,000 | $769,000 | $850,000 | 111% | 29 |
| 664 Galloping Hill Rd | Contemporary, Ranch | 3,384 | 4 | 3/1 | $888,000 | $888,000 | $900,000 | 101% | 14 |
| 32 Blaine St | Colonial | 1,244 | 3 | 1/1 | $439,000 | $429,000 | $415,000 | 95% | 158 |
| 212 Bullard St, Unit #212 | Colonial, Half Duplex | 1,661 | 3 | 2/1 | $479,000 | $479,000 | $490,000 | 102% | 24 |
| 1032 Valley Rd | Cape Cod, Contemporary | 1,664 | 4 | 2/0 | $475,000 | $475,000 | $500,000 | 105% | 69 |
| 222 Samp Mortar Dr | Cape Cod | 1,690 | 3 | 2/0 | $634,900 | $634,900 | $680,000 | 107% | 27 |
| 193 S. Benson Rd | Colonial | 1,841 | 3 | 2/0 | $775,000 | $725,000 | $725,000 | 94% | 97 |
| 142 Trillium Rd | Colonial | 3,050 | 4 | 2/1 | $729,000 | $729,000 | $755,000 | 104% | 16 |
| 44 Ferguson Dr | Colonial | 3,065 | 4 | 2/1 | $799,000 | $770,000 | $765,000 | 96% | 62 |
| 179 Partridge Ln | Colonial | 3,568 | 5 | 3/1 | $900,000 | $890,000 | $880,000 | 98% | 120 |
| 580 Rolling Hills Dr | Colonial | 4,542 | 5 | 3/0 | $899,000 | $899,000 | $880,000 | 98% | 108 |
| 311 Rolling Hills Dr | Colonial | 5,632 | 4 | 4/1 | $1,049,000 | $1,029,000 | $963,000 | 92% | 75 |
| 365 Lalley Blvd | Colonial | 4,524 | 5 | 4/1 | $1,775,000 | $1,775,000 | $1,645,000 | 93% | 208 |
| 933 Jennings Rd | Ranch | 1,809 | 3 | 3/0 | $527,500 | $527,500 | $500,000 | 95% | 59 |
| 254 Homeland St | Colonial | 1,862 | 3 | 1/1 | $480,000 | $480,000 | $500,000 | 104% | 13 |
| 150 Primrose Ln | Colonial | 3,015 | 4 | 3/1 | $699,000 | $699,000 | $715,000 | 102% | 29 |
| 72 Melville Ave | Colonial | 1,284 | 3 | 2/0 | $475,000 | $450,000 | $440,000 | 93% | 104 |
| 180 Primrose Ln | Colonial | 3,008 | 3 | 3/1 | $669,000 | $669,000 | $701,000 | 105% | 74 |
| 111 Sasco Hill Rd | Saltbox | 2,304 | 4 | 3/0 | $725,000 | $725,000 | $825,000 | 114% | 27 |
| 50 Bay Edge Ct | Colonial | 3,914 | 4 | 2/1 | $1,695,000 | $1,625,000 | $1,600,000 | 94% | 113 |
| 1051 Cedar Rd | Colonial, Antique | 5,327 | 5 | 5/2 | $1,950,000 | $1,950,000 | $1,816,000 | 93% | 86 |
| 72 Willow St | Colonial, Antique | 4,787 | 5 | 5/1 | $1,995,000 | $1,995,000 | $1,950,000 | 98% | 221 |
| 1081 Hillside Rd | Colonial, Antique | 5,176 | 5 | 5/1 | $1,895,000 | $1,895,000 | $2,000,000 | 106% | 46 |
| 68 Miro St | Raised Ranch | 2,314 | 3 | 3/0 | $550,000 | $535,000 | $530,000 | 96% | 45 |
| 75 James St | Colonial | 1,690 | 3 | 1/1 | $749,000 | $675,000 | $635,000 | 85% | 26 |
| 9 Curtis Ter | Ranch | 4,430 | 3 | 3/1 | $699,000 | $699,000 | $701,000 | 100% | 41 |
| 160 Stella Ln | Colonial | 5,750 | 5 | 5/1 | $949,000 | $899,000 | $860,000 | 91% | 168 |
| 267 Wakeman Ln | Colonial | 3,928 | 4 | 2/2 | $975,000 | $975,000 | $975,000 | 100% | 62 |
| 45 Jeniford Rd | Colonial | 3,278 | 4 | 3/1 | $975,000 | $975,000 | $1,025,000 | 105% | 13 |
| 9 Newman Pl | Colonial | 1,780 | 2 | 1/0 | $429,000 | $429,000 | $425,000 | 99% | 86 |
| 55 Pepperbush Ln | Colonial | 2,045 | 3 | 2/1 | $475,000 | $475,000 | $491,000 | 103% | 21 |
| 298 Figlar Ave | Colonial | 2,144 | 4 | 3/0 | $749,000 | $749,000 | $775,000 | 103% | 17 |
| 38 Morehouse Dr | Colonial | 4,270 | 5 | 5/1 | $1,175,000 | $1,175,000 | $1,180,000 | 100% | 53 |
| 30 Laurel Brook Ln | Colonial | 8,616 | 6 | 8/1 | $1,899,000 | $1,899,000 | $1,782,500 | 94% | 163 |
| 289 Fair Oak Dr | Colonial | 6,862 | 6 | 6/1 | $2,850,000 | $2,850,000 | $2,700,000 | 95% | 69 |
| 697 Tunxis Hill Rd | Cape Cod, Bungalow | 1,140 | 3 | 1/1 | $387,654 | $387,654 | $385,000 | 99% | 67 |
| 697 Tunxis Hill Rd | Cape Cod, Bungalow | 1,140 | 3 | 1/1 | $387,654 | $387,654 | $385,000 | 99% | 67 |
| 94 Limerick Rd | Colonial | 2,048 | 3 | 1/1 | $769,000 | $769,000 | $755,000 | 98% | 17 |
| 103 Ann St | Colonial | 2,095 | 4 | 3/0 | $850,000 | $850,000 | $890,000 | 105% | 78 |
| 666 Sturges Hwy | Contemporary, Modern | 3,068 | 4 | 3/1 | $789,000 | $789,000 | $790,000 | 100% | 48 |
| 71 Yarrow Rd | Colonial | 3,322 | 5 | 3/1 | $900,000 | $847,000 | $821,000 | 91% | 141 |
| 99 Oriole Ln | Colonial | 2,712 | 4 | 2/1 | $679,000 | $679,000 | $670,000 | 99% | 322 |
| 857 Bronson Rd | Colonial, Antique | 2,029 | 2 | 3/0 | $699,000 | $699,000 | $747,000 | 107% | 26 |
| 83 Wheeler Park Ave | Cape Cod, Colonial | 2,323 | 5 | 2/0 | $509,000 | $509,000 | $497,000 | 98% | 35 |
| 267 Westlea Rd | Colonial | 3,692 | 4 | 2/1 | $995,000 | $950,000 | $908,000 | 91% | 128 |
| 45 Lindbergh St | Colonial | 1304 | 3 | 2/0 | $499,999 | $499,999 | $550,000 | 110% | 8 |
| 672 Church Hill Rd | Colonial | 1,566 | 3 | 1/1 | $575,000 | $575,000 | $575,000 | 100% | 52 |
| 89 Rakoczy Ave | Colonial | 1,760 | 3 | 2/1 | $549,000 | $549,000 | $575,000 | 105% | 42 |
| 15 Deer Park Rd | Colonial | 4,251 | 4 | 3/1 | $1,249,000 | $1,249,000 | $1,232,500 | 99% | 42 |
| 991 Pequot Ave | Colonial, Contemporary | 3,622 | 4 | 3/2 | $1,925,000 | $1,925,000 | $1,900,000 | 99% | 115 |
| 237 Bennett St | Cape Cod | 1,140 | 3 | 2/0 | $414,900 | $400,000 | $405,000 | 98% | 33 |
| 29 Brookmere Dr | Colonial, Cottage | 1,694 | 3 | 1/1 | $525,000 | $525,000 | $550,000 | 105% | 33 |
| 37 Dunhill Dr | Colonial | 2,050 | 4 | 2/0 | $679,000 | $665,000 | $625,000 | 92% | 127 |
| 2470 Hillside Rd | Colonial | 4047 | 4 | 4/2 | 799000 | 799000 | 757000 | 0.947434293 | 41 |
| 165 High Point Ln | Colonial | 4877 | 5 | 4/1 | $1,498,000 | $1,498,000 | $1,560,000 | 104% | 22 |
| 703 Verna Hill Rd | Colonial, Contemporary | 5690 | 5 | 4/2 | 1649000 | 1649000 | 1649000 | 1 | 21 |
| 47 Elderberry Ln | Colonial | 2309 | 4 | 2/1 | 485000 | 485000 | 460000 | 0.948453608 | 14 |
| 2031 N. Benson Rd | Ranch | 2424 | 3 | 2/0 | 525000 | 525000 | 535000 | 1.019047619 | 22 |
| 61 Fox Run Rd | Cape Cod, Colonial | 2115 | 4 | 2/0 | 650000 | 650000 | 681000 | 1.047692308 | 17 |
| 74 Westford Dr | Colonial | 2009 | 3 | 2/1 | 699000 | 699000 | 699000 | 1 | 10 |
| 21 Indian Point Rd | Ranch | 3044 | 3 | 2/0 | 829000 | 829000 | 810000 | 0.97708082 | 69 |
| 116 Sasco Hill Rd | Colonial, Antique | 4398 | 4 | 3/1 | 1595000 | 1595000 | 1595000 | 1 | 25 |
| Units Sold: 88 | 729000 | 725000 | 730000 | 0.990675991 | 47 |