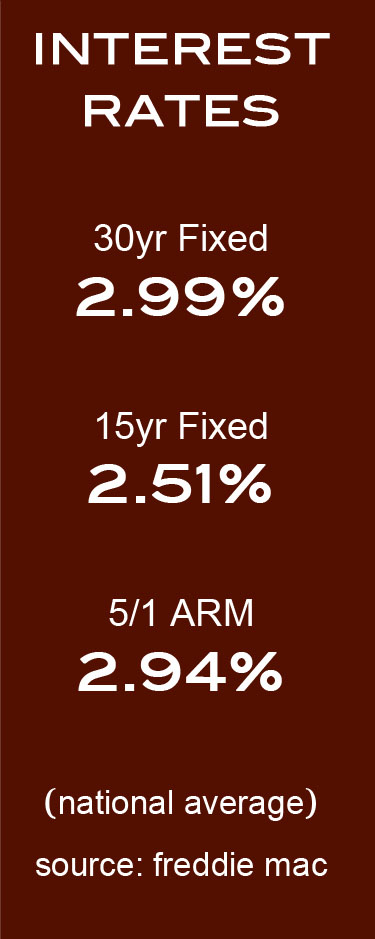
July saw some continued gains in real estate activity for Orange. Perhaps the most significant increase was in the median sales price, up 16% from June, to $435,000. This brings it to a nearly 28% increase for the year, since January’s median sales price of $340,000. The number of houses sold also increased by a sizeable number, 8 in June to 24 in July. This trend may continue into August since pending sales in July were at 27, more than double those in June. The months of supply for Orange was 3.4, which keeps it in a sellers-market for nearly a year. The number of new listings dropped from 20 to 18 which could point to a stable market moving forward. The days on market were higher than in June, and higher than surrounding towns, where buyers were making quick decisions to purchase, and many homes saw multiple bids. Interest rates are still incredibly low: the 30-year fixed rate was at 2.99% by the end of July. This trend continues to push buyers into the market and has been helping sellers overcome anxiety over listing their homes during the ongoing Coronavirus pandemic. Do you know anyone looking for more information about their real estate market? I’d be happy to help.
12 Month Sales Activity

Housing Stats
(change from previous month)
| Median Sale Price: | $440,000 |
| change: | 17.33% |
| YTD change: | 29.41% |
| Units Sold: | 25 |
| change: | 212.50% |
| Active Listings: | 33 |
| change: | -23.26% |
| New Listings: | 18 |
| change: | -10.00% |
| Days on Market: | 86 |
| change: | 86.96% |
| Months of Supply: | 3.30 (Seller's Market) |
| change: | -23.26% |
Economic News:
Stock Market: July saw continued gains in the US stock market, with increases in all three major indexes. The Dow Jones was gained 2.3% in July, while the S%P 500 gained 4.2% and the Nasdaq was up 4.3%. Most of the pandemic losses have now recovered: year-to-date, the S&P 500 was up 0.5% by the end of July and the Nasdaq was up 18%. The Dow Jones still has some catching up to do, down 7.8% for the year.
Employment: For a third straight month, the national unemployment rate has dropped. By the end of July, the rate was 10.2%; still higher than the 4.4% pre-pandemic rate. July saw an increase of 1.8 million jobs, primarily in the leisure and hospitality sectors. This increase has slowed compared to June’s 4.8 million jobs added, primarily due to the fear of a second wave of Covid-19 in many states.
Real Estate: Buyers needs have been shifting since the pandemic, focusing less on high end amenities and more on space and outdoor features. Square footage and living space have been top priorities, focusing less on open floor plans and more on personal space for family members.
2020 Local Real Estate Price Trends:
2020 continues to be a strong year for the area real estate markets when compared to 2019’s first 7 months. Most towns show increases in median sales price. Easton, which is still down 1.03% actually improved from last month’s number, which was down 11.52%.
| 1/19-7/19 | 1/20-7/20 | Change | |
| Bethel | $345,000 | $355,750 | 3.12% |
| Bridgeport | $200,000 | $225,000 | 12.50% |
| Easton | $558,250 | $552,500 | -1.03% |
| Fairfield | $583,000 | $639,950 | 9.77% |
| Milford | $299,950 | $338,750 | 12.94% |
| Monroe | $379,950 | $379,500 | -0.12% |
| Newtown | $385,000 | $412,500 | 7.14% |
| Norwalk | $488,445 | $510,000 | 4.41% |
| Orange | $368,500 | $370,000 | 0.41% |
| Redding | $534,000 | $552,500 | 3.46% |
| Ridgefield | $635,000 | $635,000 | 0.00% |
| Shelton | $337,500 | $350,000 | 3.70% |
| Stratford | $250,000 | $275,000 | 10.00% |
| Trumbull | $385,000 | $412,000 | 7.01% |
| Weston | $675,000 | $710,000 | 5.19% |
| Westport | $1,196,250 | $1,250,000 | 4.49% |
| Wilton | $725,000 | $762,500 | 5.17% |
1- Buyers are in a rush: Nationwide, buyers are looking at 3-4 homes before making an offer, compared to 9 homes a year ago.
2- Wish lists are shifting: Home shoppers priorities have been changing. The top desired feature is a home office, followed by outdoor space with an interest in a pool, garden and bigger yards.
3- Commute time is less important: With the increase of remote work, many buyers are expanding their home search further from their offices physical location.
4- Multigenerational households are becoming more common: Trends suggest that Gen Xers and Millennials have been considering sharing a home with an older parent. This translates to need for larger sized homes and first floor living space.
5- Pets are playing a bigger factor in home purchasing decisions: Having space to accommodate a pet, fenced in yard has been a growing factor is some home purchase decisions.
6- First-time homebuyers are on the rise: More young people have been making home purchases prior to marriage, and there has been an increase in roommates pooling their money in order to purchase a house together.
7- Housing tenure may fall: Over the past few years, homeowners have been staying longer in their homes then in past decades. This may change due to a need to find a home that better meets their growing desire for more space and better home workspace.
Due to high unemployment and economic recession, some Americans were predicting a gloomy housing picture. The opposite has been true.
Myth #1: It’s a bad time to sell a home: The reality has been that with record low interest rates, buyers have been sparking bidding wars in many markets with limited inventory.
Myth #2: Home prices are dropping: The opposite has been true. In most markets, home prices have been rising, as much as 7% for the year. Again, fueled by low interest rates and low inventory.
Myth #3: Everyone is rushing to the suburbs: While the suburbs have received an increase in demand from city buyers, this is more the case with wealthier buyers who have the resources to move.
Sales Trends: January-July

July Single-Family Home Sales
(OLP: original list price • LP: list price • SP: sale price • DOM: days on market)
| Address | Style | sq ft | BR | BA (f/h) | OLP | LP | SP | SP/OLP | DOM |
| 795 Donna Dr. | Colonial, Saltbox | 2,085 | 4 | 2/1 | $350,000 | $339,900 | $320,000 | 91% | 94 |
| 503 Carriage Dr. | Ranch | 1,917 | 3 | 2/0 | $429,900 | $429,900 | $430,000 | 100% | 4 |
| 20 Shepherd Lane | Colonial | 3,588 | 4 | 2/1 | $549,000 | $537,500 | $510,000 | 93% | 157 |
| 70 Russell Ave. | Cape Cod | 1,520 | 3 | 1/1 | $319,900 | $299,900 | $297,000 | 93% | 104 |
| 355 Miles Rd. | Contemporary | 3,228 | 4 | 3/1 | $479,900 | $479,900 | $465,000 | 97% | 56 |
| 435 Treat Lane | Colonial, French | 4,934 | 4 | 4/1 | $1,150,000 | $1,150,000 | $1,110,000 | 97% | 54 |
| 19 Hampton Close | Colonial | 3,696 | 4 | 3/1 | $599,000 | $589,000 | $550,000 | 92% | 138 |
| 139 Wildrose Rd. | Contemporary | 4,399 | 4 | 4/1 | $674,500 | $674,500 | $650,000 | 96% | 127 |
| 37 Rolling Ridge Rd. | Raised Ranch | 1,562 | 3 | 2/1 | $350,000 | $350,000 | $325,000 | 93% | 8 |
| 886 Orange Center Rd. | Colonial | 2,072 | 4 | 1/1 | $350,000 | $299,000 | $240,000 | 69% | 144 |
| 312 Hawthorne Lane | Ranch | 2,044 | 3 | 2/1 | $309,900 | $309,900 | $325,000 | 105% | 3 |
| 21 Crofut Rd. | Ranch | 1,656 | 4 | 3/0 | $409,900 | $409,900 | $400,000 | 98% | 97 |
| 357 Ridge Rd. | Ranch | 1,932 | 3 | 2/0 | $429,900 | $429,900 | $441,000 | 103% | 2 |
| 500 Fairway Rd. | Colonial | 2,823 | 4 | 2/1 | $434,900 | $434,900 | $441,000 | 101% | 13 |
| 25 Hampton Close | Cape Cod, Colonial | 3,615 | 4 | 2/1 | $799,900 | $648,000 | $648,000 | 81% | 253 |
| 129 Cherry Hill Rd. | Ranch | 2,828 | 4 | 3/0 | $464,900 | $464,900 | $440,000 | 95% | 86 |
| 350 Woodland Lane | Ranch | 3,420 | 4 | 3/0 | $599,000 | $599,000 | $565,000 | 94% | 87 |
| 650 Saint Johns Dr. | Colonial | 4,651 | 5 | 4/1 | $1,199,000 | $1,199,000 | $1,175,000 | 98% | 131 |
| 571 Summit Dr. | Split Level | 1,562 | 3 | 2/0 | $349,900 | $339,900 | $330,000 | 94% | 81 |
| 630 Lakeview Rd. | Ranch | 1,469 | 3 | 1/1 | $349,900 | $349,900 | $359,900 | 103% | 25 |
| 980 Derby Milford Rd. | Colonial | 1,408 | 3 | 1/0 | $299,900 | $299,900 | $280,000 | 93% | 76 |
| 541 Locust Dr. | Ranch | 2,134 | 4 | 2/0 | $250,000 | $250,000 | $245,000 | 98% | 73 |
| 457 Pine Tree Dr. | Colonial | 2,352 | 4 | 2/1 | $389,900 | $389,900 | $405,000 | 104% | 45 |
| 62 Rolling Ridge Rd. | Ranch | 3,380 | 4 | 2/1 | $539,000 | $525,000 | $493,000 | 91% | 101 |
| Units Sold: 24 | $429,900 | $429,900 | $435,000 | 96% | 84 |