10 Most Horrifying Decorative Trends: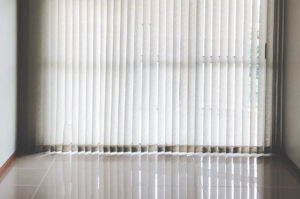
The short list of things people are most afraid of shouldn’t include the property you’ve just listed. But if the home’s staging brings undead design fads back to life, buyers are going to scream bloody murder. REALTOR® Magazine’s Styled, Staged & Sold blog used staging surveys and feedback from professional designers to develop our choices for this year’s scariest home decor trends. 1. Toilet Seat Covers: Adding toilet rugs or furry seat covers to the commode may be the worst offense of all. In fact, a 2018 Samsung survey of designers from the United Kingdom found the decorative element to be the most despised home design trend over the past 50 years. 2. Inspirational Quote Art: Tired sayings, such as “love you to the moon and back,” may be losing popularity. “EAT” signs in the kitchen and “LAUNDRY” signs in the laundry room are obvious and redundant, and thankfully, they’re starting to disappear, too. 3. Popcorn Ceilings: The textured ceilings have long popped up on designers’ most-hated lists. While statement ceilings are trending, the popcorn ceiling has failed to make a comeback. 4. Ruffles and Florals: The 1980s sure did love its floral chintz. The pattern was popular on ruffled bed skirts, curtains, and furniture. While bigger floral prints have made a comeback, the smaller and ruffled versions have not. 5. Wallpaper Borders: The wallpaper border hung at the edge of walls, offering a touch of design without the commitment of wallpapering the entire room. Twelve percent of designers call it one of the worst trends ever, according to the Samsung survey. While ivy and floral wallpaper borders may now be outdated, wallpaper itself is not—particularly for your ceiling. 6. Hollywood Vanity Lights: They may have made you feel like a star, but the placement of bulging bulbs above the bathroom mirror has fallen out of favor. The harsh lighting has been replaced with warmer, softer fixtures like wall sconces. 7. Round Beds: Furniture with curves is a re-emerging trend, but it never should have included beds. These space-age beds trended in the 1960s. Seventeen percent of designers placed “round beds” on their hate list, according to the Samsung survey. 8. Wood Paneling: Dark brown wood paneling was a popular and affordable design option for walls in the 1960s and ’70s. The outdated look can put a room in an instant time warp. Still, wood paneling has experienced a comeback, but more modern options include shiplap and lighter wood tones. Usually, these items are used as an accent and not for the entire room. 9. Vertical Blinds: While vertical blinds served as a practical solution for window coverings in the 1990s, designers now think the trend can make a room look outdated. The trendier choice nowadays: curtains—or better yet, bare windows that let natural light flow in. 10. Artificial Fruit: That bowl of fake pears and grapes wasn’t really fooling anyone back in the ’80s and ’90s. Try a real bowl of fruit, such as apples or lemons, as a centerpiece. Real fruit is a stager’s favorite trick to dress up a countertop. |