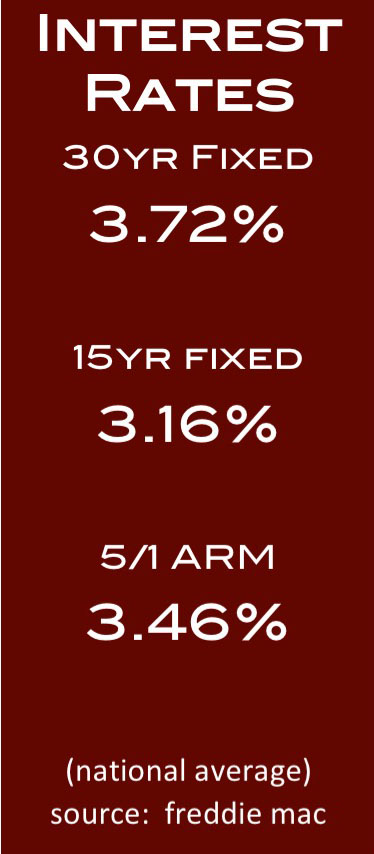
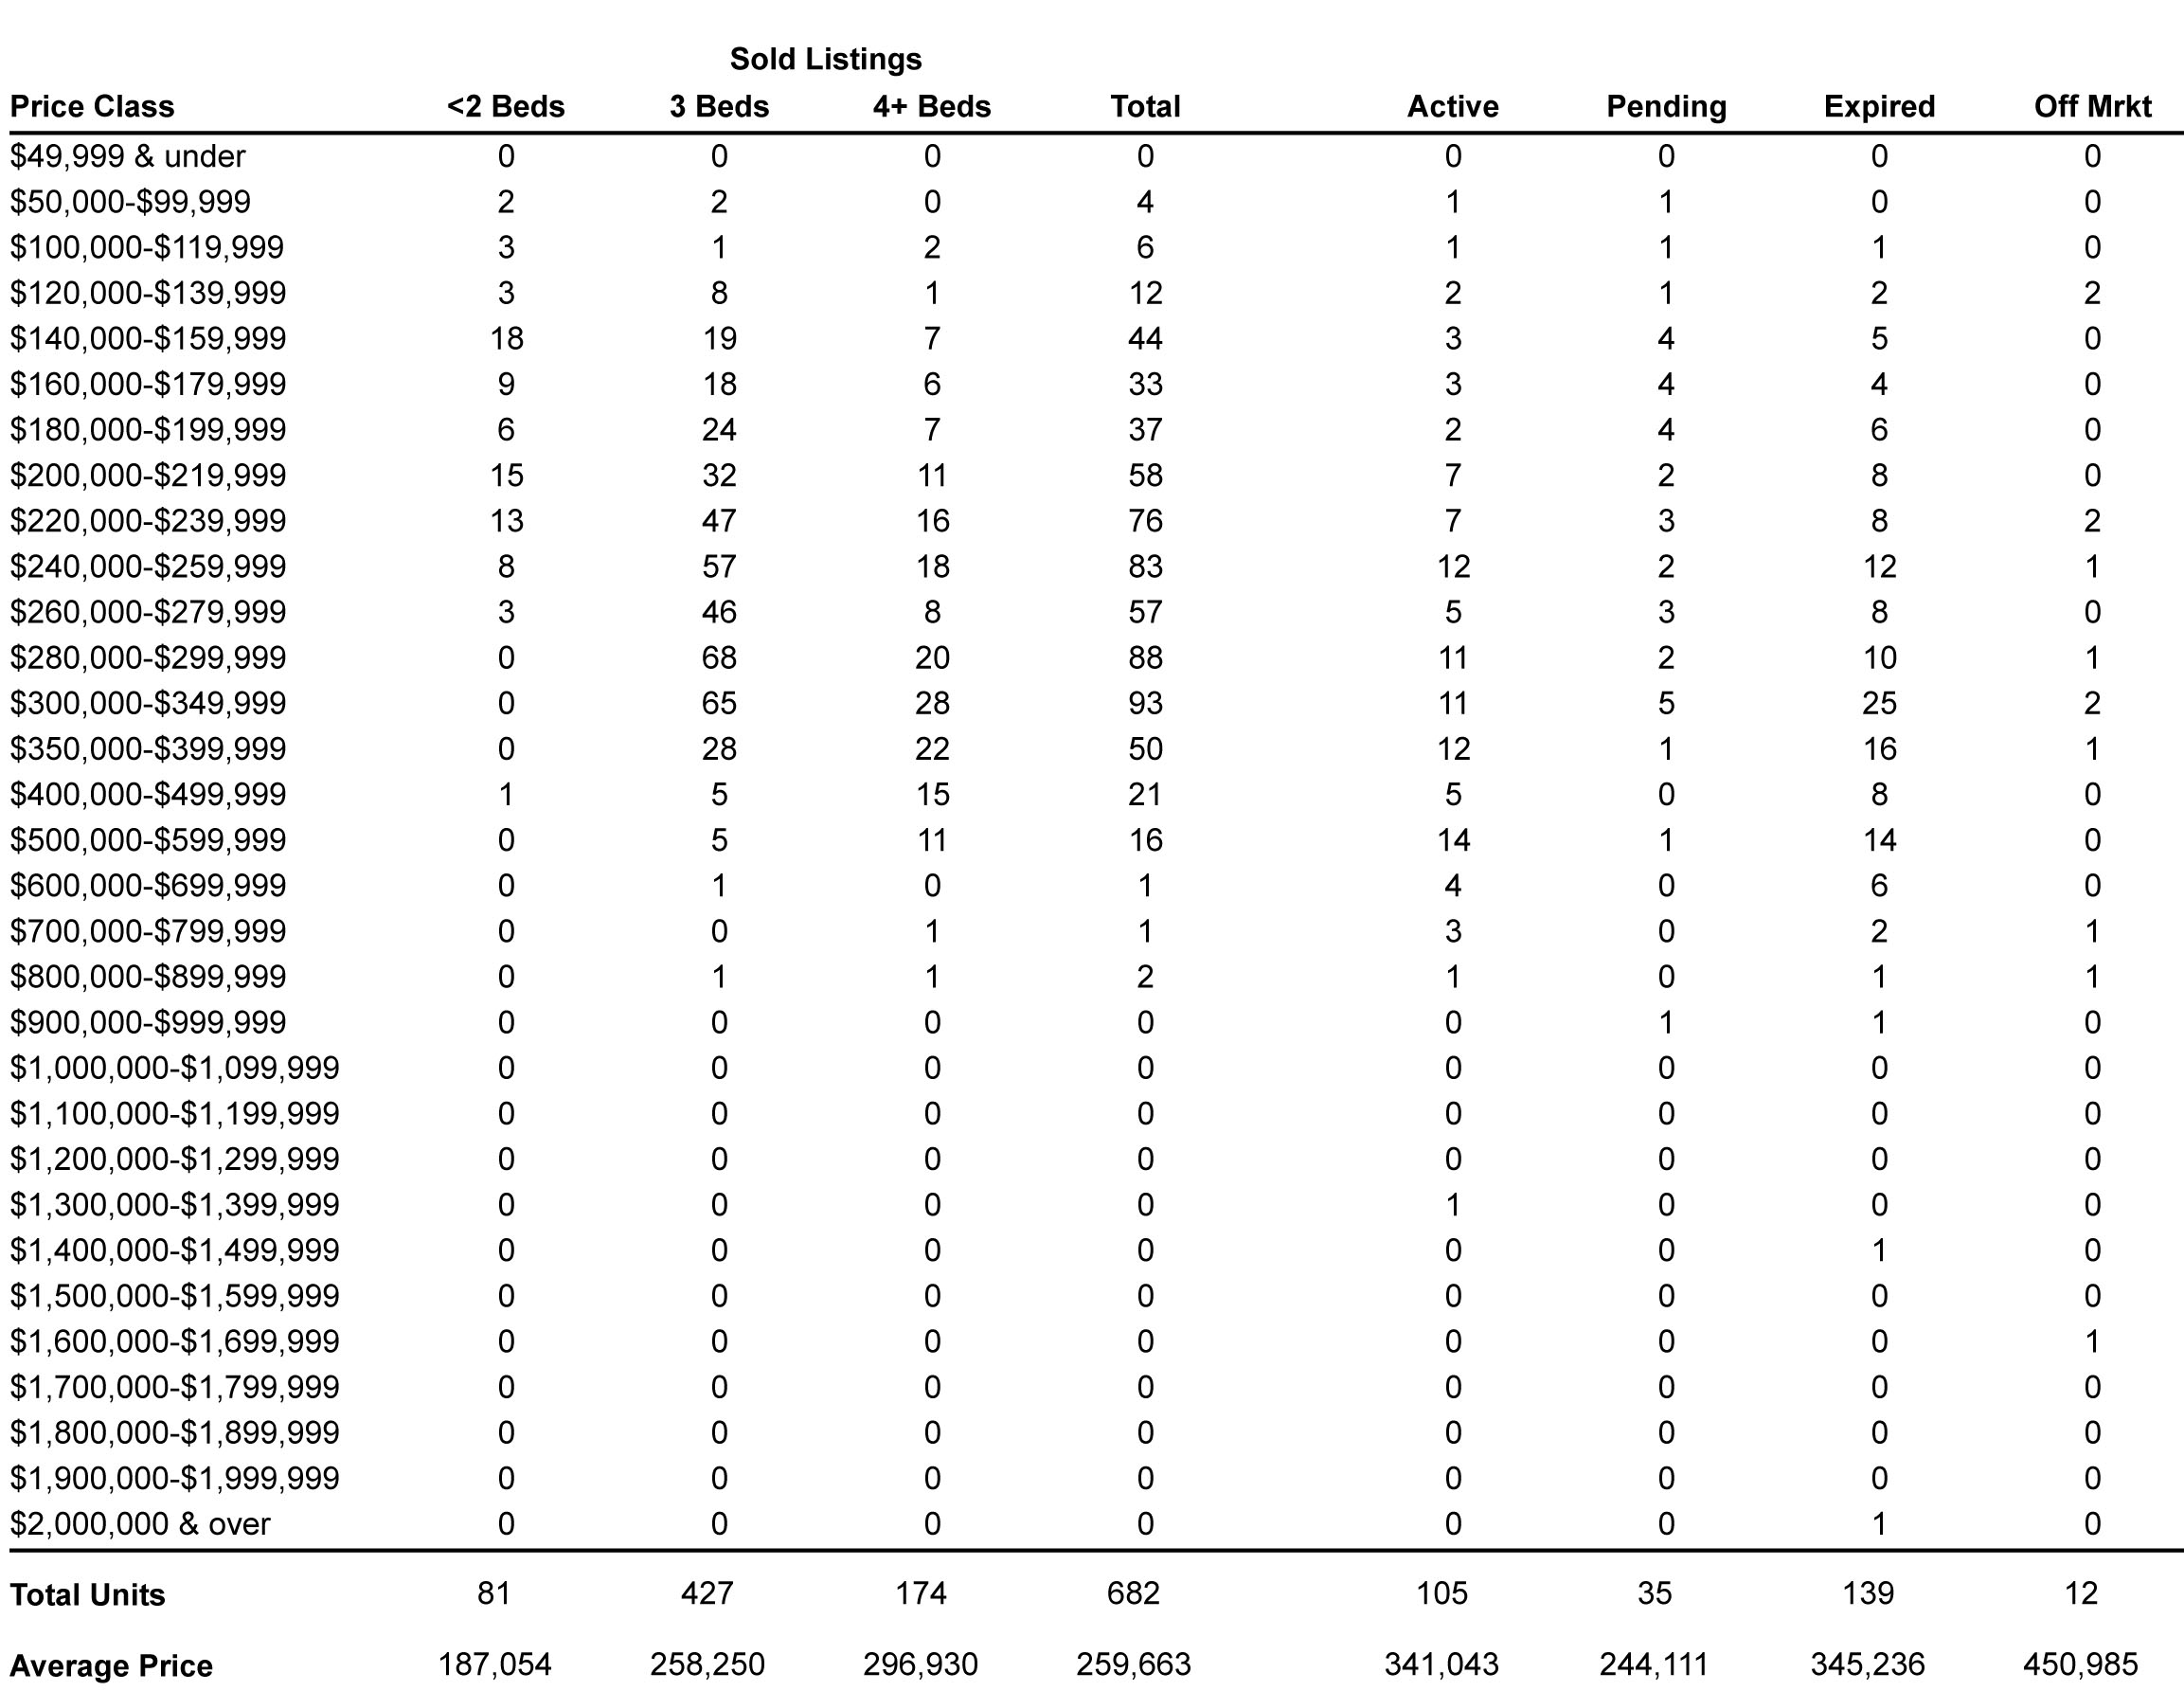
Stratford’s housing market continued to favor sellers in December with the months of supply continuing to drop for the 7thstraight month. Inventory was down more than 18% which meant buyers had to look a little harder to find their homes, but when they did, the homes sold quicker: 61 days compared to 71 days in November. The sellers-market is also reflected in the 5.49% increase in the median sales price from $237,000 to $250,000. The number of new listings continued their 7-month drop; 41 homes came on the marked in December. The numbers show that buyers continue to be interested in Stratford, especially in the sub $300,000 price range. Interest rates continue to be favorable for both buyer and refinancers at 3.72%. If you have any questions, or if you know anyone who is thinking of buying or selling real estate, I’d be happy to speak with you.
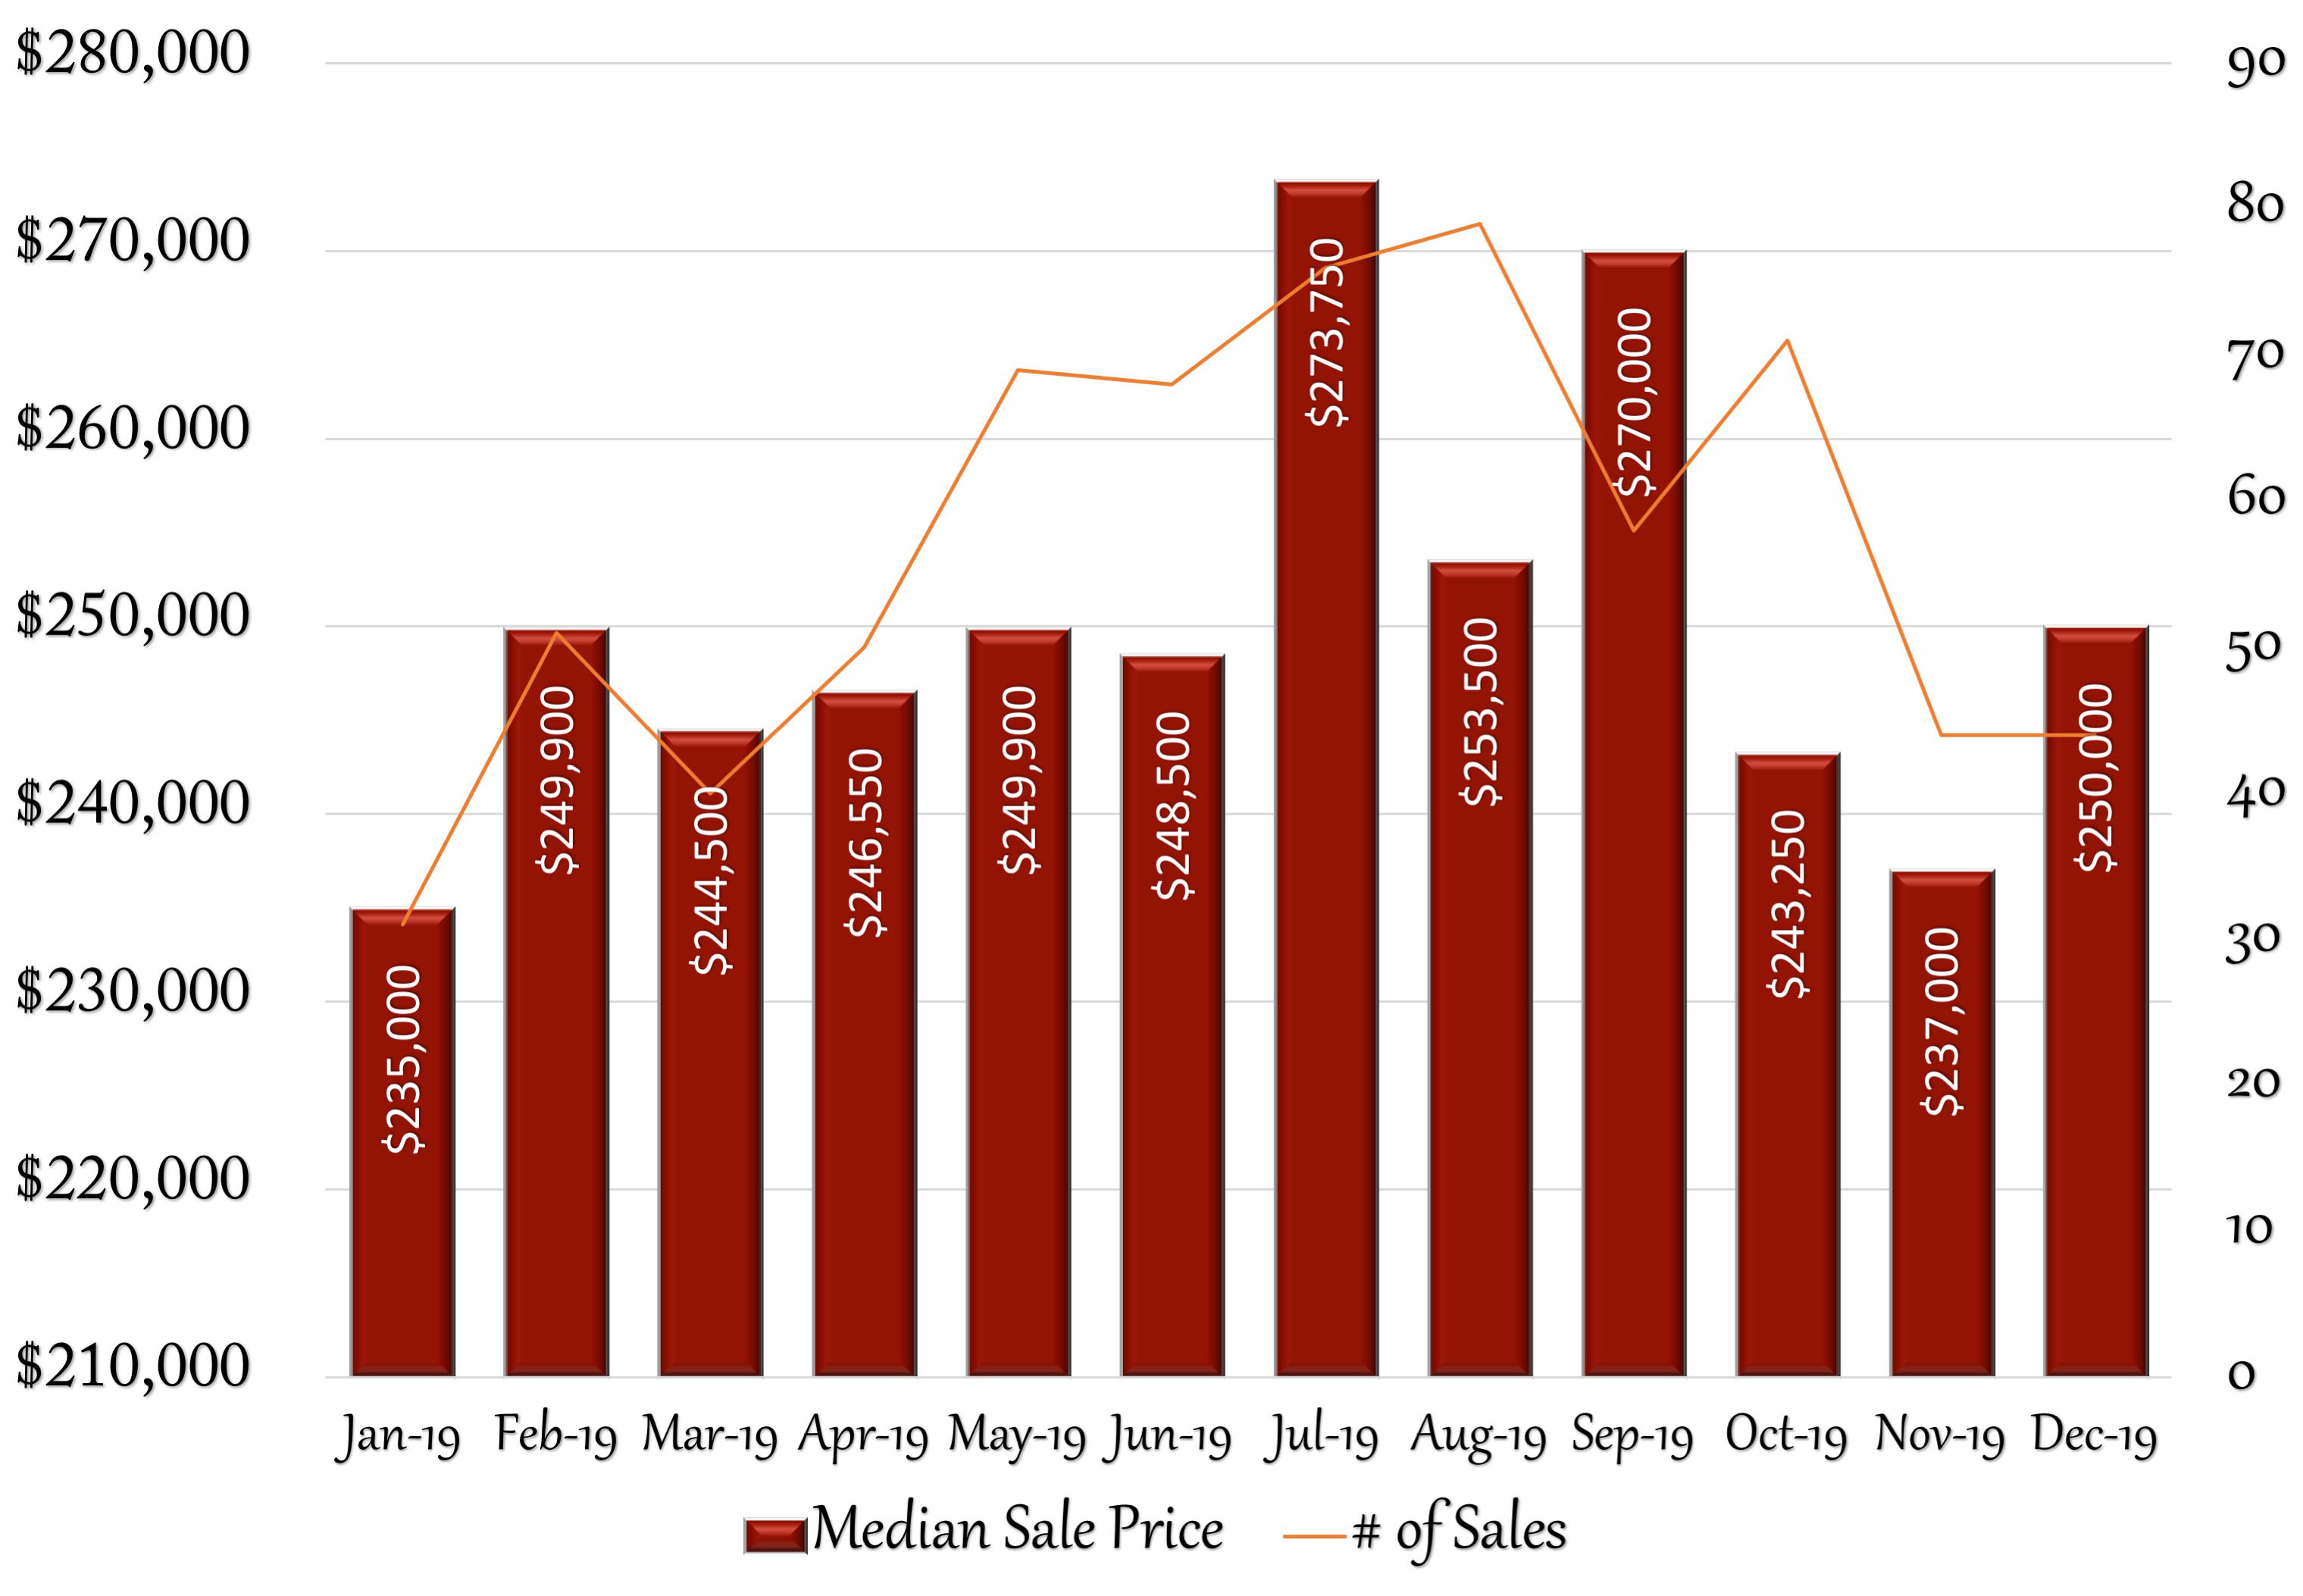
12 Month Sales Activity
Housing Stats
(change from previous month)
| Median Sale Price: | $250,000 |
| change: | 5.49% |
| YTD change: | 6.38% |
| Units Sold: | 44 |
| change: | 0.00% |
| Active Listings: | 139 |
| change: | -18.71% |
| New Listings: | 41 |
| change: | -10.87% |
| Days on Market: | 61 |
| change: | -14.08% |
| Months of Supply: | 2.40 (Seller's Market) |
| change: | -20.00% |
December Single-Family Home Sales
(OLP: original list price • LP: list price • SP: sale price • DOM: days on market)
| Address | Style | sq ft | BR | BA (f/h) | OLP | LP | SP | SP/OLP | DOM |
| 5605 Main St. | Colonial | 2,902 | 5 | 2/0 | $299,900 | $250,000 | $200,000 | 67% | 161 |
| 125 Porter St. | Ranch | 1,202 | 2 | 1/0 | $225,000 | $225,000 | $220,000 | 98% | 25 |
| 380 Keating Dr. | Raised Ranch | 2,048 | 3 | 2/1 | $329,900 | $319,000 | $319,000 | 97% | 78 |
| 32 Sutton Ave. | Colonial | 1,898 | 4 | 2/0 | $345,000 | $324,740 | $324,450 | 94% | 198 |
| 289 Roosevelt Ave. | Half Duplex | 1,152 | 3 | 1/1 | $155,000 | $155,000 | $145,000 | 94% | 61 |
| 71 Greenlawn Ave. | Cape Cod | 1,160 | 4 | 1/0 | $220,000 | $220,000 | $170,599 | 78% | 62 |
| 959 Wells Place | Colonial | 1,729 | 4 | 1/1 | $145,000 | $145,000 | $190,000 | 131% | 8 |
| 137 Matthew Dr. | Colonial | 1,965 | 4 | 1/1 | $329,900 | $329,900 | $320,000 | 97% | 56 |
| 246 Delaware Dr. | Cape Cod | 1,476 | 4 | 1/0 | $138,900 | $138,900 | $138,900 | 100% | 21 |
| 235 Tavern Rock Rd. | Ranch | 3,088 | 3 | 2/1 | $329,900 | $309,000 | $307,000 | 93% | 82 |
| 1495 Huntington Rd. | Raised Ranch | 2,120 | 3 | 2/1 | $339,900 | $339,900 | $325,000 | 96% | 51 |
| 15 Hemlock St. | Cape Cod | 1,201 | 4 | 1/1 | $185,000 | $185,000 | $150,000 | 81% | 16 |
| 709 Success Ave. | Cape Cod | 1,131 | 3 | 2/0 | $229,900 | $205,000 | $202,000 | 88% | 176 |
| 248 Sherwood Place | Colonial | 1,425 | 3 | 1/1 | $239,900 | $229,900 | $225,000 | 94% | 103 |
| 55 Johnson Lane | Ranch | 1,697 | 3 | 1/1 | $279,000 | $279,000 | $279,000 | 100% | 8 |
| 100 Maple Oak Dr., Unit #100 | Colonial | 2,774 | 3 | 2/1 | $459,000 | $459,000 | $468,120 | 102% | 14 |
| 569 2nd Hill Lane | Colonial | 1,836 | 3 | 1/1 | $269,900 | $259,900 | $255,900 | 95% | 53 |
| 66 Parkway Dr. | Colonial | 1,232 | 3 | 1/1 | $309,900 | $299,900 | $277,500 | 90% | 62 |
| 565 Stonybrook Rd. | Cape Cod | 1,193 | 3 | 1/0 | $175,000 | $180,000 | $150,000 | 86% | 419 |
| 170 West Ave. | Colonial | 1,104 | 3 | 2/0 | $175,000 | $175,000 | $180,000 | 103% | 69 |
| 274 Cedar Knoll Dr. | Ranch | 1,722 | 3 | 2/0 | $259,900 | $239,900 | $224,000 | 86% | 32 |
| 50 Champion Terrace | Cape Cod | 1,413 | 4 | 2/0 | $260,000 | $260,000 | $255,000 | 98% | 77 |
| 53 Reitter St. | Colonial | 1,759 | 3 | 2/0 | $284,900 | $274,900 | $283,147 | 99% | 96 |
| 46 Edwin St. | Cape Cod | 1,998 | 3 | 2/1 | $299,900 | $299,900 | $299,000 | 100% | 13 |
| 376 Windsor Ave. | Colonial | 1,569 | 3 | 1/1 | $299,900 | $299,900 | $310,000 | 103% | 19 |
| 295 2nd Ave. | Cape Cod | 2,427 | 3 | 2/0 | $325,000 | $320,000 | $318,000 | 98% | 46 |
| 80 Florence St. | Ranch | 1,972 | 3 | 1/1 | $399,900 | $375,000 | $375,000 | 94% | 64 |
| 561 Henry Avenue Ext. | Cape Cod | 1,160 | 3 | 1/0 | $135,200 | $135,200 | $144,500 | 107% | 26 |
| 131 Newton St. | Cape Cod | 1,134 | 2 | 1/0 | $149,900 | $149,900 | $150,000 | 100% | 37 |
| 1053 Wells Place | Colonial | 1,321 | 2 | 1/1 | $249,900 | $249,900 | $245,000 | 98% | 4 |
| 180 Peace Acre Lane | Ranch | 1,872 | 4 | 3/0 | $389,900 | $389,900 | $368,000 | 94% | 60 |
| 81 Wyoming St. | Cape Cod | 1,562 | 4 | 2/1 | $279,900 | $279,900 | $279,900 | 100% | 79 |
| 376 Soundview Ave. | Cape Cod | 1,340 | 3 | 2/0 | $280,000 | $236,000 | $230,000 | 82% | 159 |
| 197 Victory St. | Colonial | 1,932 | 5 | 1/1 | $189,900 | $189,900 | $172,500 | 91% | 67 |
| 1319 E. Main St. | Colonial | 2,268 | 4 | 1/1 | $269,900 | $269,900 | $232,500 | 86% | 70 |
| 270 Reitter St. | Cape Cod | 1,502 | 3 | 1/1 | $269,900 | $269,900 | $265,000 | 98% | 59 |
| 55 Walker Dr. | Ranch | 1,300 | 3 | 1/1 | $349,000 | $349,000 | $330,000 | 95% | 104 |
| 200 Chapel St. | Colonial | 4,402 | 4 | 2/2 | $629,900 | $599,900 | $540,000 | 86% | 159 |
| 134 Dewey St. | Colonial | 1,390 | 3 | 1/1 | $199,500 | $188,900 | $175,000 | 88% | 52 |
| 90 Garden St. | Ranch | 1,152 | 3 | 1/1 | $200,000 | $200,000 | $211,500 | 106% | 42 |
| 670 E. Main St. | Ranch | 1,379 | 3 | 2/0 | $285,000 | $285,000 | $285,000 | 100% | 21 |
| 241 4th Ave. | Colonial | 1,900 | 4 | 2/0 | $409,900 | $409,900 | $409,000 | 100% | 93 |
| 100 Bunnell Ave. | Colonial | 2,104 | 4 | 1/1 | $299,000 | $199,000 | $199,000 | 67% | 184 |
| 28 Drake St. | Ranch, Bungalow | 954 | 2 | 1/0 | $209,900 | $209,900 | $211,000 | 101% | 19 |
| 10 Wilbrook Rd. | Ranch | 1,453 | 3 | 1/1 | $329,000 | $319,999 | $319,000 | 97% | 54 |
| Units Sold: 44 | $279,000 | $260,000 | $255,000 | 97% | 60 |
Sales Trends: January-December
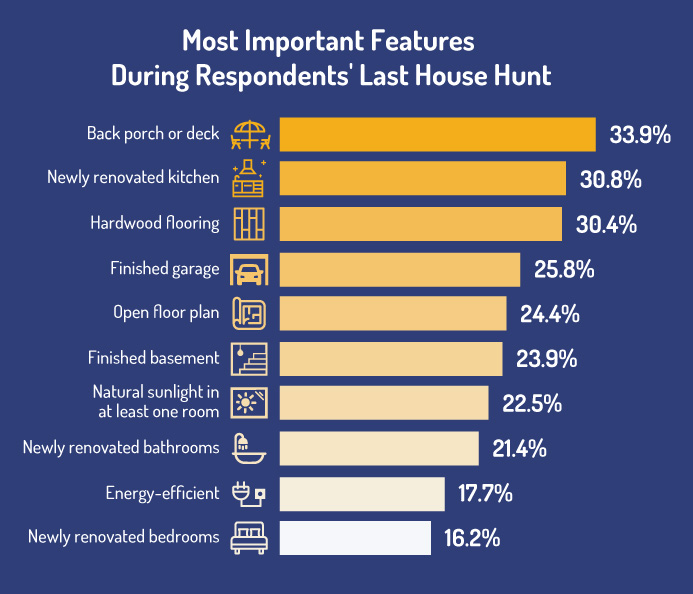
Most In-Demand Home Features:
Curious about which home features are most important to buyers? A recent survey by Porch.com reveals that the number 1 most sought-after home feature amongst buyers is a back porch or deck. Close 2nd and 3rd were a newly renovated kitchen and hardwood flooring. The ever-popular open-floor plan came in at a surprisingly 5th on the list trailing behind a finished garage. Other desired features included a finished basement, natural light, newly renovated bathrooms, energy efficiency and newly renovated bedrooms. The back porch or deck was the number one feature for baby boomers, generation x and millennials alike. On average, buyers were willing to pay between an additional $2,532 – $4,570 more than their budget for homes with the features they most desired.