Serving New Haven and Fairfield Counties | Contact: (203) 895-2783
Menu
Menu
Fairfield Market Report March 2021
Market Overview
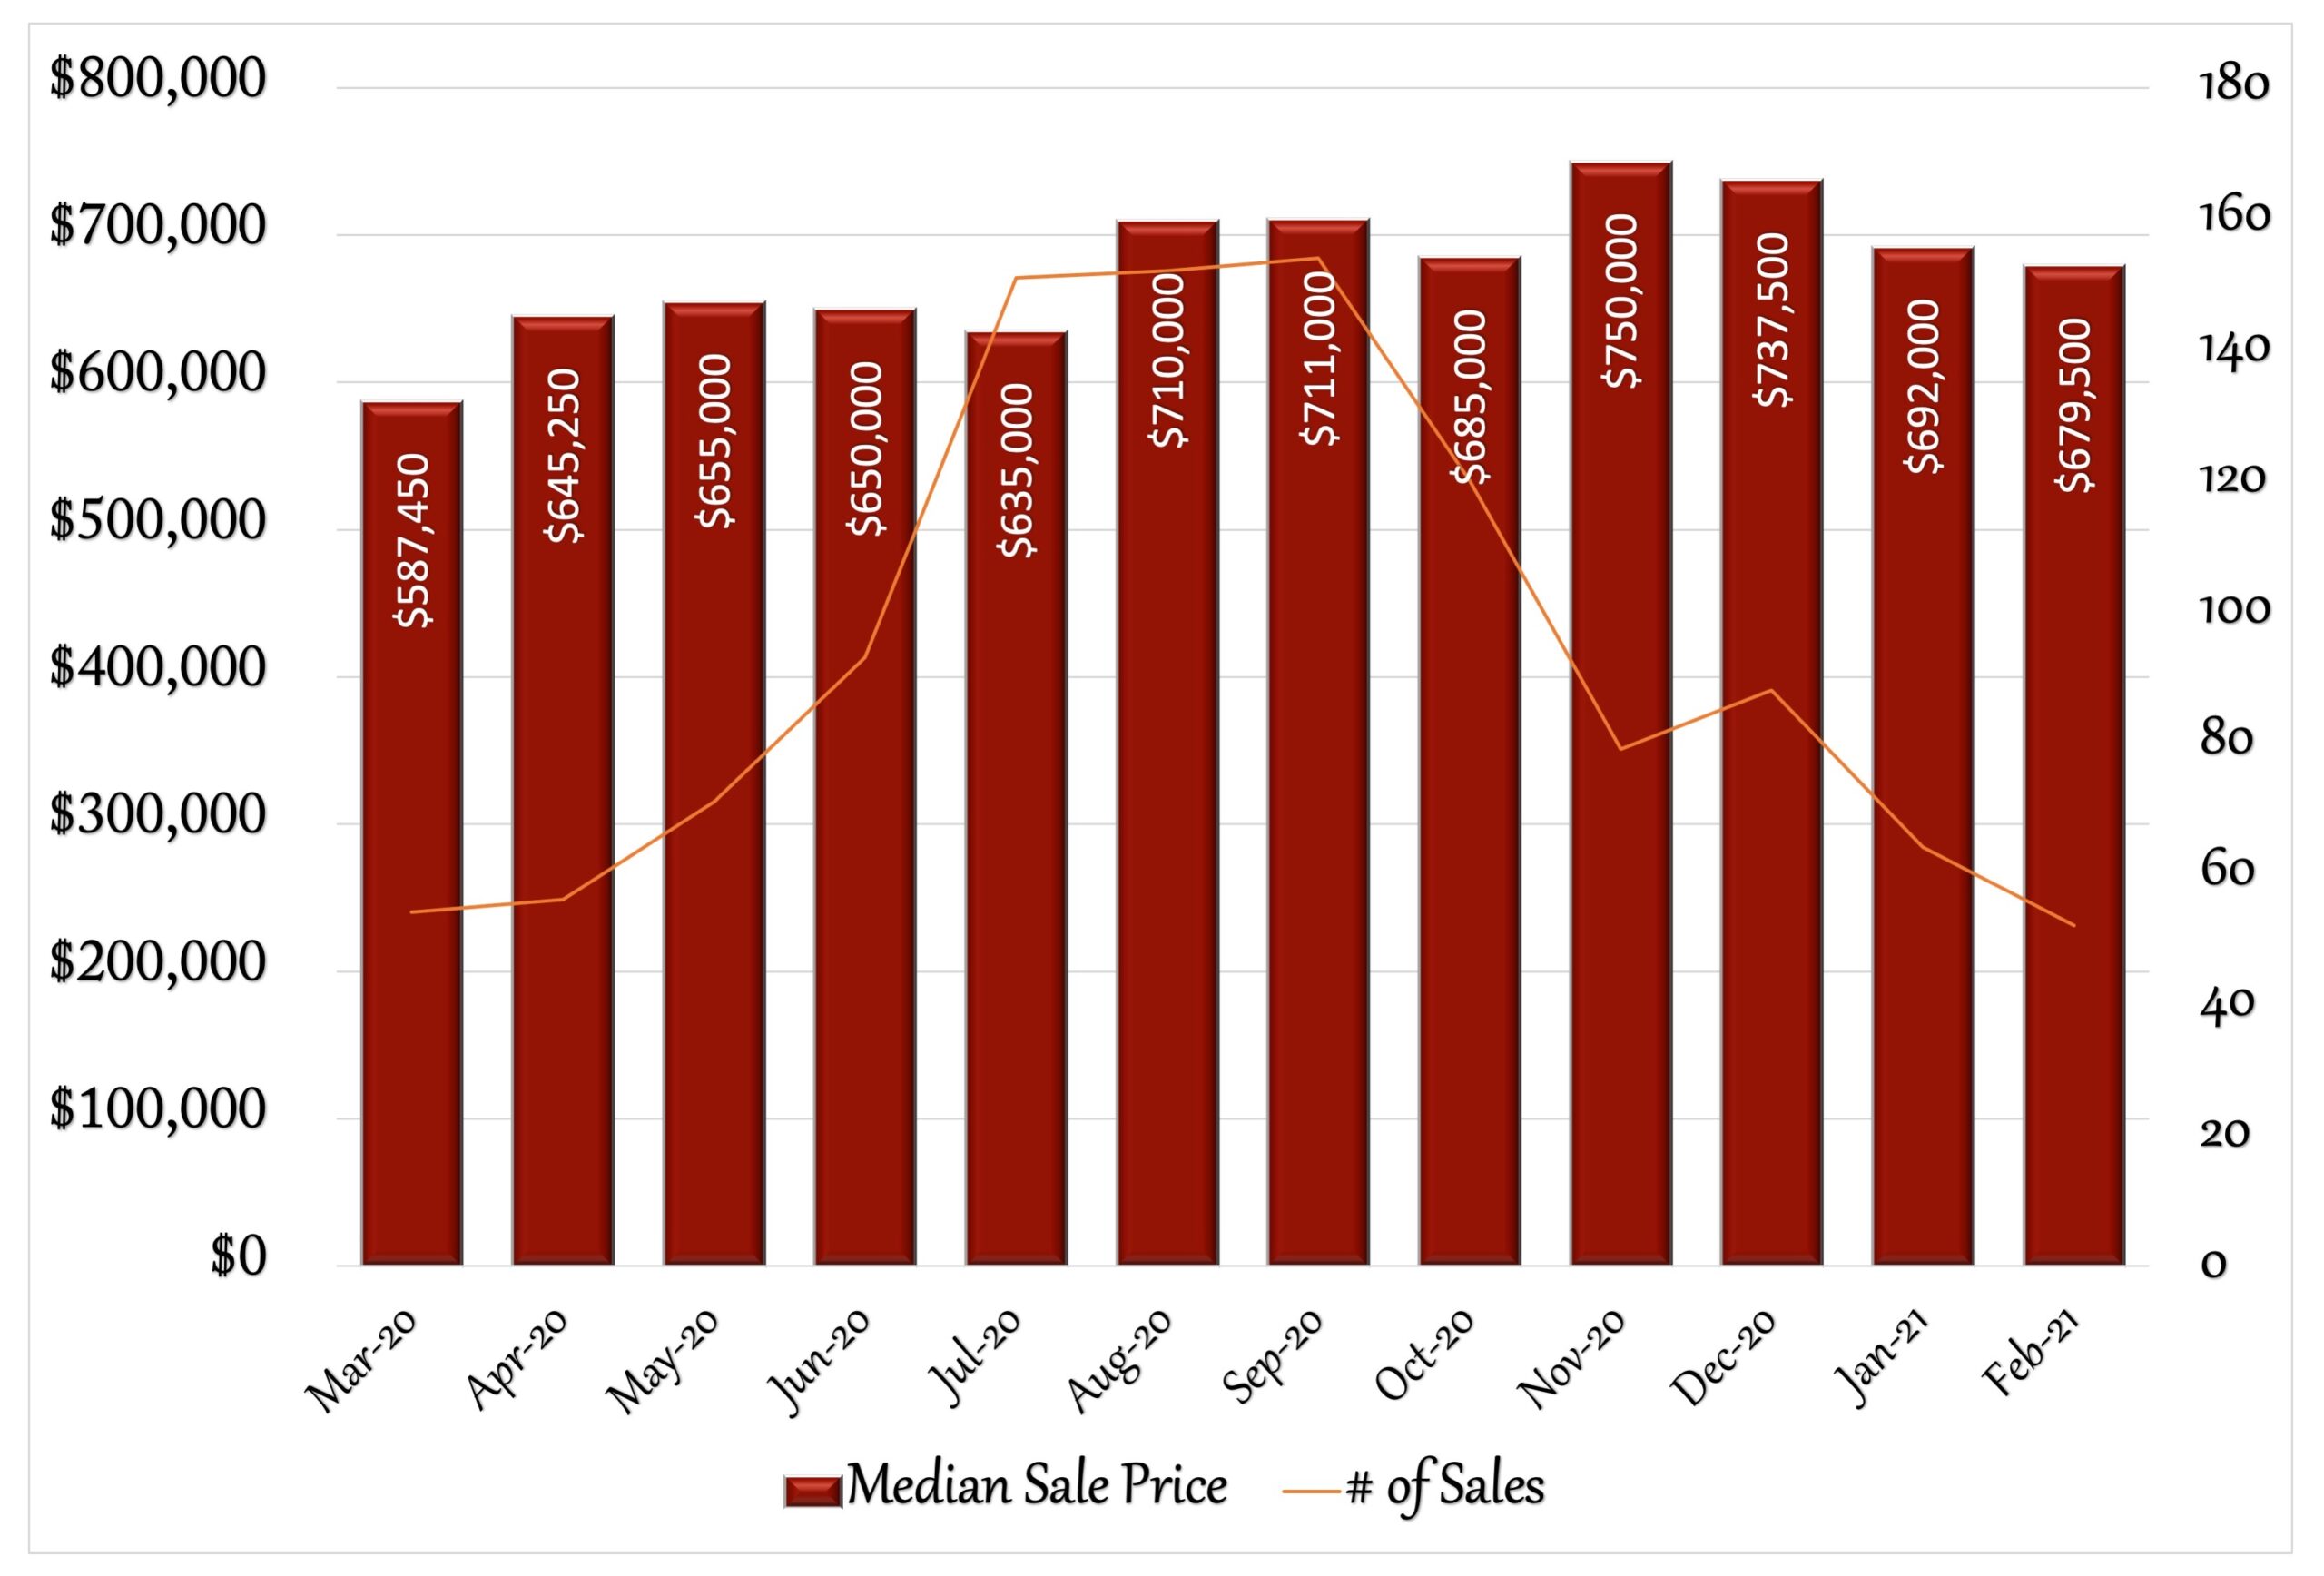
The housing market in Fairfield continued to cool in February, as single family home values dropped for a third month in a row. The median sales price was down 1.81% in February to $679,500, compared with $692,000 in January. The price peaked in November at $750,000, the highest monthly price since September 2007. Activity also continued to decline as the number of units sold dropped from 64 in January to 52 in February and the number of new listings dropped slightly, from 81 to 78. The time it took to sell houses increased from 39 days in January to 58 days in February, also suggesting a slowing market. Inventory continues to be very low, with another monthly decrease in the number of houses for sale. 166 in February, compared to a year ago with 440. Even with the decrease in activity, Fairfield continues to be in a strong sellers-market, with just 1.8 months of housing supply available (6 months is considered a stable market between buyers and sellers). Although the monthly median sales price has fallen, 2021 is still turning out to be a peak year at $672,500. This is well above the high prior to the great recession set in 2007 at $635,000. Interest rates have been on the rise the last two months. By the end of February, the 30yr fixed rate was 3.02%, a 10% increase from the previous month. However, rates still continue to be at historic low levels, and buyers are looking to buy homes at great rates, frustrated by the lack of inventory. This is still an excellent time to sell. Do you know anyone looking for more information about their real estate market? I’d be happy to help.
12 Month Sales Activity
Housing Stats
(change from previous month)
| Median Sale Price: | $679,500 |
| change: | -1.81% |
| YTD change: | -1.81% |
| Units Sold: | 52 |
| change: | -18.75% |
| Active Listings: | 166 |
| change: | -5.14% |
| New Listings: | 78 |
| change: | -3.70% |
| Days on Market: | 58 |
| change: | 48.72% |
| Months of Supply: | 1.80 (Seller's Market) |
| change: | -10.00% |
Interest Rates

Local Median Sales Price Trends
| Jan-21 | Feb-21 | Change | |
| Bethel | $527,473 | $430,000 | -18.48% |
| Bridgeport | $268,500 | $250,000 | -6.89% |
| Brookfield | $550,000 | $432,500 | -21.36% |
| Danbury | $367,500 | $357,000 | -2.86% |
| Easton | $675,000 | $612,125 | -9.31% |
| Fairfield | $692,000 | $679,500 | -1.81% |
| Milford | $345,000 | $408,000 | 18.26% |
| Monroe | $434,000 | $430,000 | -0.92% |
| Newtown | $450,000 | $465,000 | 3.33% |
| Orange | $394,900 | $386,000 | -2.25% |
| Oxford | $465,000 | $373,250 | -19.73% |
| Redding | $477,500 | $702,500 | 47.12% |
| Seymour | $270,000 | $268,000 | -0.74% |
| Shelton | $393,000 | $370,000 | -5.85% |
| Stratford | $327,500 | $342,500 | 4.58% |
| Trumbull | $485,000 | $450,000 | -7.22% |
| Weston | $810,000 | $1,212,000 | 49.63% |
| Westport | $1,555,000 | $1,600,000 | 2.89% |
| Wilton | $870,000 | $705,000 | -18.97% |
Real Estate Headlines
Most Popular Markets for Gen X Home Buyers: Generation X, those born between 1965 and 1980—are in their peak earning years, and increasingly turning to real estate. They often make up more than a quarter of home buyers in the nation’s largest metros, just behind millennials. The top 10 metro areas for Gen X buyers in 2020 were Memphis, TN, Jacksonville, FL, Atlanta, GA, Washington, DC, Orlando FL, Miami, FL, New Orleans, LA, Baltimore, MD, Tampa, FL and Raleigh, NC.
10 Fastest-Growing Retirement Towns: About 28.6 million baby boomers retired in the third quarter of 2020 alone, according to Pew Research Center data. That has prompted a growing number of new retirees to seek out the perfect place to ride out their golden years in retirement—and Florida isn’t the only place they’re targeting. Retirees might be able to cash out pretty significant equity in their homes and find something more affordable, or maybe find something better for the same price in a location that’s generally more affordable. They’re also relocating to be closer to their adult children or their grandchildren. According to Realtor.com research collected between 2014 and 2019, the ten fastest-growing retirement destinations (with median home list price) are: Lakeland, FL ($260,050), Traverse City, MI ($419,950), Springfield, MA ($300,050), Coeur d’Alene, ID (850,050), Wilmington, NC ($382,550), Winchester, VA (339,050), and Portland, ME ($451,450), Salisbury, MD (360,050), Albany, NY (360,050 )and Hartford, CT (302,850).
Mortgage Rates Top 3% as Would-be Buyers Pull Back: The 30-year fixed-rate mortgage topped the 3% threshold, averaging 3.02% this week, Freddie Mac reports. Despite the uptick, economists note that mortgage rates remain near historical lows. Since reaching an all-time low in January, mortgage rates have risen by more than 30 basis points, “and the impact on purchase demand has been noticeable,” says Sam Khater, Freddie Mac’s chief economist. “While purchase activity remains high, it has cooled off over the last few weeks and is currently on par with early March, prior to the pandemic.” Still, Khater predicts that the rise in mortgage rates over the next couple of months will likely be more muted in comparison to the last few weeks. The National Association of REALTORS® agrees, forecasting the 30-year fixed-rate mortgage to average 3% for the first half of this year. Expected job gains as the economy opens up may help lift buyer demand regardless of mortgage rate movement.
Report: 50% Fewer Homes for Sale This Year: The spring homebuying season is expected to be fierce for house hunters. Here’s the reason: More than 200,000 new listings have been absent from the U.S. housing market during the first two months of 2021 compared to levels seen over the last four years. Buyer demand is surging and there aren’t enough homes for sale. Inventory woes were common in markets even prior to the pandemic, but they’ve worsened since. There are nearly 50% fewer homes for sale this year than last year, according to realtor.com®’s newly released Monthly Housing Trends Report. What’s more, home buyers are seeing prices quickly rise. The median listing price nationwide in February increased nearly 14% over last year to $353,000. Unless we see some big improvements in the new listings trends over the coming months, buyers can expect stiff competition.
Real Estate Pros to Homeowners: Don’t Wait to Sell: A lot of homeowners are missing the best market now by waiting to sell. They are finding themselves with more negotiating power as buyer demand remains high and housing inventories are slim. The high demand is sparking home prices to surge. The median home price was $303,900 for an existing home in January—a 14% jump from the year prior, according to the National Association of REALTORS®. Homeowner equity has grown. Thirty percent of homes with a mortgage in the U.S. are now considered “equity-rich”. So what’s holding sellers back? They often have to buy as well and are struggling to find a home to move to. Potential sellers fear they’ll pay more for a comparable home, even if they’re downsizing. Strategies to help sellers deal with the stress: 1) buy first because this way they can take their time and not feel rushed or jump into any house just because they need to hurry up and move out. 2) list their homes and then accept an offer from a buyer who is willing to wait while they find a place to buy. 3) negotiate a rent-back agreement to allow them more time to shop for a home.
Sales Trends: January - February
February Single-Family Home Sales
(OLP: original list price • LP: list price • SP: sale price • DOM: days on market)
| Address | Style | sq ft | BR | BA (f/h) | OLP | LP | SP | SP/OLP | DOM |
| 98 Andrassy Ave | Ranch | 864 | 3 | 1/0 | $329,500 | $329,500 | $315,000 | 96% | 43 |
| 140 London Ter | Colonial, Split Level | 2,086 | 3 | 2/1 | $545,900 | $545,900 | $523,000 | 96% | 119 |
| 583 Jennings Rd | Cape Cod | 1,008 | 3 | 1/0 | $439,000 | $439,000 | $430,000 | 98% | 49 |
| 151 Burroughs Rd | Ranch, Split Level | 1,908 | 3 | 2/0 | $479,000 | $479,000 | $484,000 | 101% | 48 |
| 1106 Valley Rd | Colonial | 1,960 | 3 | 2/0 | $599,000 | $599,000 | $590,000 | 98% | 70 |
| 139 Brett Rd | Colonial | 2,658 | 3 | 3/1 | $638,000 | $638,000 | $860,000 | 135% | 7 |
| 181 Henderson Rd | Colonial | 1,274 | 2 | 1/1 | $430,000 | $430,000 | $429,500 | 100% | 28 |
| 155 Woodrow Ave | Colonial | 2,872 | 3 | 2/1 | $849,000 | $799,000 | $800,000 | 94% | 82 |
| 180 Brookbend Rd | Colonial | 4,558 | 5 | 3/1 | $1,375,000 | $1,199,000 | $1,155,000 | 84% | 140 |
| 33 Hill Brook Ln | Colonial | 4,913 | 4 | 2/2 | $899,900 | $849,900 | $770,000 | 86% | 59 |
| 272 Fairfield Beach Rd | Colonial | 4,771 | 5 | 4/1 | $2,995,000 | $2,995,000 | $2,855,000 | 95% | 78 |
| 14 Sterling St | Colonial | 2,640 | 4 | 2/1 | $535,000 | $535,000 | $525,000 | 98% | 23 |
| 324 Mine Hill Rd | Colonial | 9,635 | 6 | 5/2 | $4,295,000 | $4,295,000 | $3,950,000 | 92% | 105 |
| 300 Winnepoge Dr | Colonial | 3,261 | 4 | 3/0 | $949,000 | $872,000 | $855,000 | 90% | 62 |
| 121 Roanoke Ave | Colonial, Row House | 1,000 | 2 | 1/0 | $315,000 | $315,000 | $311,000 | 99% | 51 |
| 57 Woodridge Ave | Cape Cod | 1,680 | 3 | 2/0 | $484,900 | $464,900 | $450,000 | 93% | 81 |
| 90 Webb Rd | Cape Cod, Colonial | 3,826 | 5 | 3/1 | $699,000 | $699,000 | $675,000 | 97% | 88 |
| 145 Primrose Ln | Colonial | 2,355 | 4 | 2/1 | $669,000 | $669,000 | $679,000 | 101% | 49 |
| 78 Edgewood Pl | Colonial | 1,580 | 3 | 1/1 | $479,000 | $479,000 | $470,000 | 98% | 68 |
| 304 Lancelot Rd | Colonial | 4,432 | 5 | 2/1 | $879,000 | $849,000 | $770,000 | 88% | 84 |
| 72 Rose Hill Rd | Colonial, Antique | 2,263 | 3 | 2/1 | $1,295,000 | $1,295,000 | $1,170,000 | 90% | 94 |
| 75 Roseville St | Ranch | 1,104 | 3 | 1/0 | $339,900 | $339,900 | $327,000 | 96% | 106 |
| 5 Beacon View Dr | Cape Cod, Half Duplex | 1,500 | 3 | 2/0 | $292,000 | $292,000 | $292,000 | 100% | 45 |
| 56 Brookview Ave | Ranch, Bungalow | 1,238 | 2 | 1/0 | $425,000 | $425,000 | $433,000 | 102% | 28 |
| 196 York Rd | Ranch | 2,144 | 3 | 1/1 | $424,900 | $439,900 | $439,900 | 104% | 40 |
| 261 Old Farm Ln | Ranch | 2,849 | 3 | 3/1 | $639,900 | $649,900 | $650,000 | 102% | 108 |
| 365 Fence Row Dr | Colonial | 7,258 | 7 | 5/3 | $1,275,000 | $975,000 | $975,000 | 76% | 188 |
| 139 Northwood Rd | Colonial | 2,710 | 5 | 3/1 | $815,000 | $815,000 | $815,000 | 100% | 35 |
| 514 High St | Cape Cod | 1,368 | 4 | 1/0 | $339,000 | $339,000 | $350,000 | 103% | 3 |
| 202 Stillson Rd, Unit #202 | Colonial | 2,995 | 3 | 2/1 | $779,000 | $729,000 | $715,000 | 92% | 196 |
| 580 Sasco Hill Rd | Colonial | 4,289 | 5 | 3/2 | $3,495,000 | $3,200,000 | $3,000,000 | 86% | 103 |
| 61 Longfellow Ave | Cape Cod | 1,654 | 3 | 1/0 | $388,000 | $379,999 | $369,000 | 95% | 37 |
| 530 Lakeview Dr | Colonial | 3,220 | 4 | 3/1 | $849,000 | $849,000 | $879,000 | 104% | 82 |
| 217 Osborne Ln | Colonial | 4,761 | 4 | 3/1 | $1,299,000 | $1,299,000 | $1,260,000 | 97% | 145 |
| 970 Old Post Rd | Colonial | 3,888 | 4 | 3/1 | $1,749,000 | $1,749,000 | $1,749,000 | 100% | 48 |
| 345 Governors Ln | Contemporary, European | 8,361 | 5 | 7/4 | $1,975,000 | $1,975,000 | $1,900,000 | 96% | 86 |
| 1522 Fairfield Beach Rd | Colonial, Other | 3,124 | 5 | 4/1 | $2,195,000 | $2,195,000 | $2,100,000 | 96% | 243 |
| 1841 Jennings Rd | Colonial | 3,451 | 4 | 2/1 | $759,000 | $749,000 | $727,500 | 96% | 57 |
| 3080 Burr St | Colonial | 4,584 | 4 | 3/1 | $1,050,000 | $1,050,000 | $1,010,000 | 96% | 24 |
| 165 Pine Creek Ave | Colonial, Contemporary | 2,752 | 4 | 3/1 | $1,650,000 | $1,650,000 | $1,625,000 | 98% | 38 |
| 1011 Pequot Ave | French | 5,819 | 5 | 4/2 | $2,998,000 | $2,998,000 | $2,650,000 | 88% | 278 |
| 73 Thorpe St | Colonial | 1,490 | 3 | 2/0 | $459,000 | $420,000 | $405,000 | 88% | 165 |
| 102 Catherine Ter | Colonial | 1,575 | 3 | 1/1 | $590,000 | $590,000 | $532,500 | 90% | 8 |
| 2025 Mill Plain Rd | Colonial | 2,085 | 3 | 1/1 | $629,900 | $629,900 | $595,000 | 94% | 54 |
| 7 Quaker Ln | Colonial | 2,023 | 3 | 2/1 | $659,000 | $659,000 | $670,000 | 102% | 31 |
| 118 Boroskey Dr | Cape Cod | 1,719 | 3 | 3/0 | $680,000 | $680,000 | $680,000 | 100% | 0 |
| 359 Fulling Mill Ln S. | Colonial | 4,893 | 5 | 3/1 | $1,249,000 | $1,249,000 | $1,249,000 | 100% | 12 |
| 3590 Congress St | Colonial, Antique | 3,828 | 4 | 4/1 | $1,595,000 | $1,595,000 | $1,535,000 | 96% | 49 |
| 1710 Stratfield Rd | Cape Cod | 1,784 | 3 | 3/0 | $469,000 | $459,000 | $440,000 | 94% | 10 |
| 65 Holiday Rd | Colonial | 2,304 | 4 | 2/1 | $695,000 | $649,000 | $622,500 | 90% | 105 |
| 59 Glen Arden Dr | Colonial | 2,993 | 4 | 2/1 | $1,050,000 | $1,050,000 | $1,075,000 | 102% | 40 |
| Units Sold: 51 | $695,000 | $680,000 | $680,000 | 96% | 57 |
Are You Interested In A Real Estate Review?