Serving New Haven and Fairfield Counties | Contact: (203) 895-2783
Menu
Menu
Stratford Market Report April 2021
Market Overview
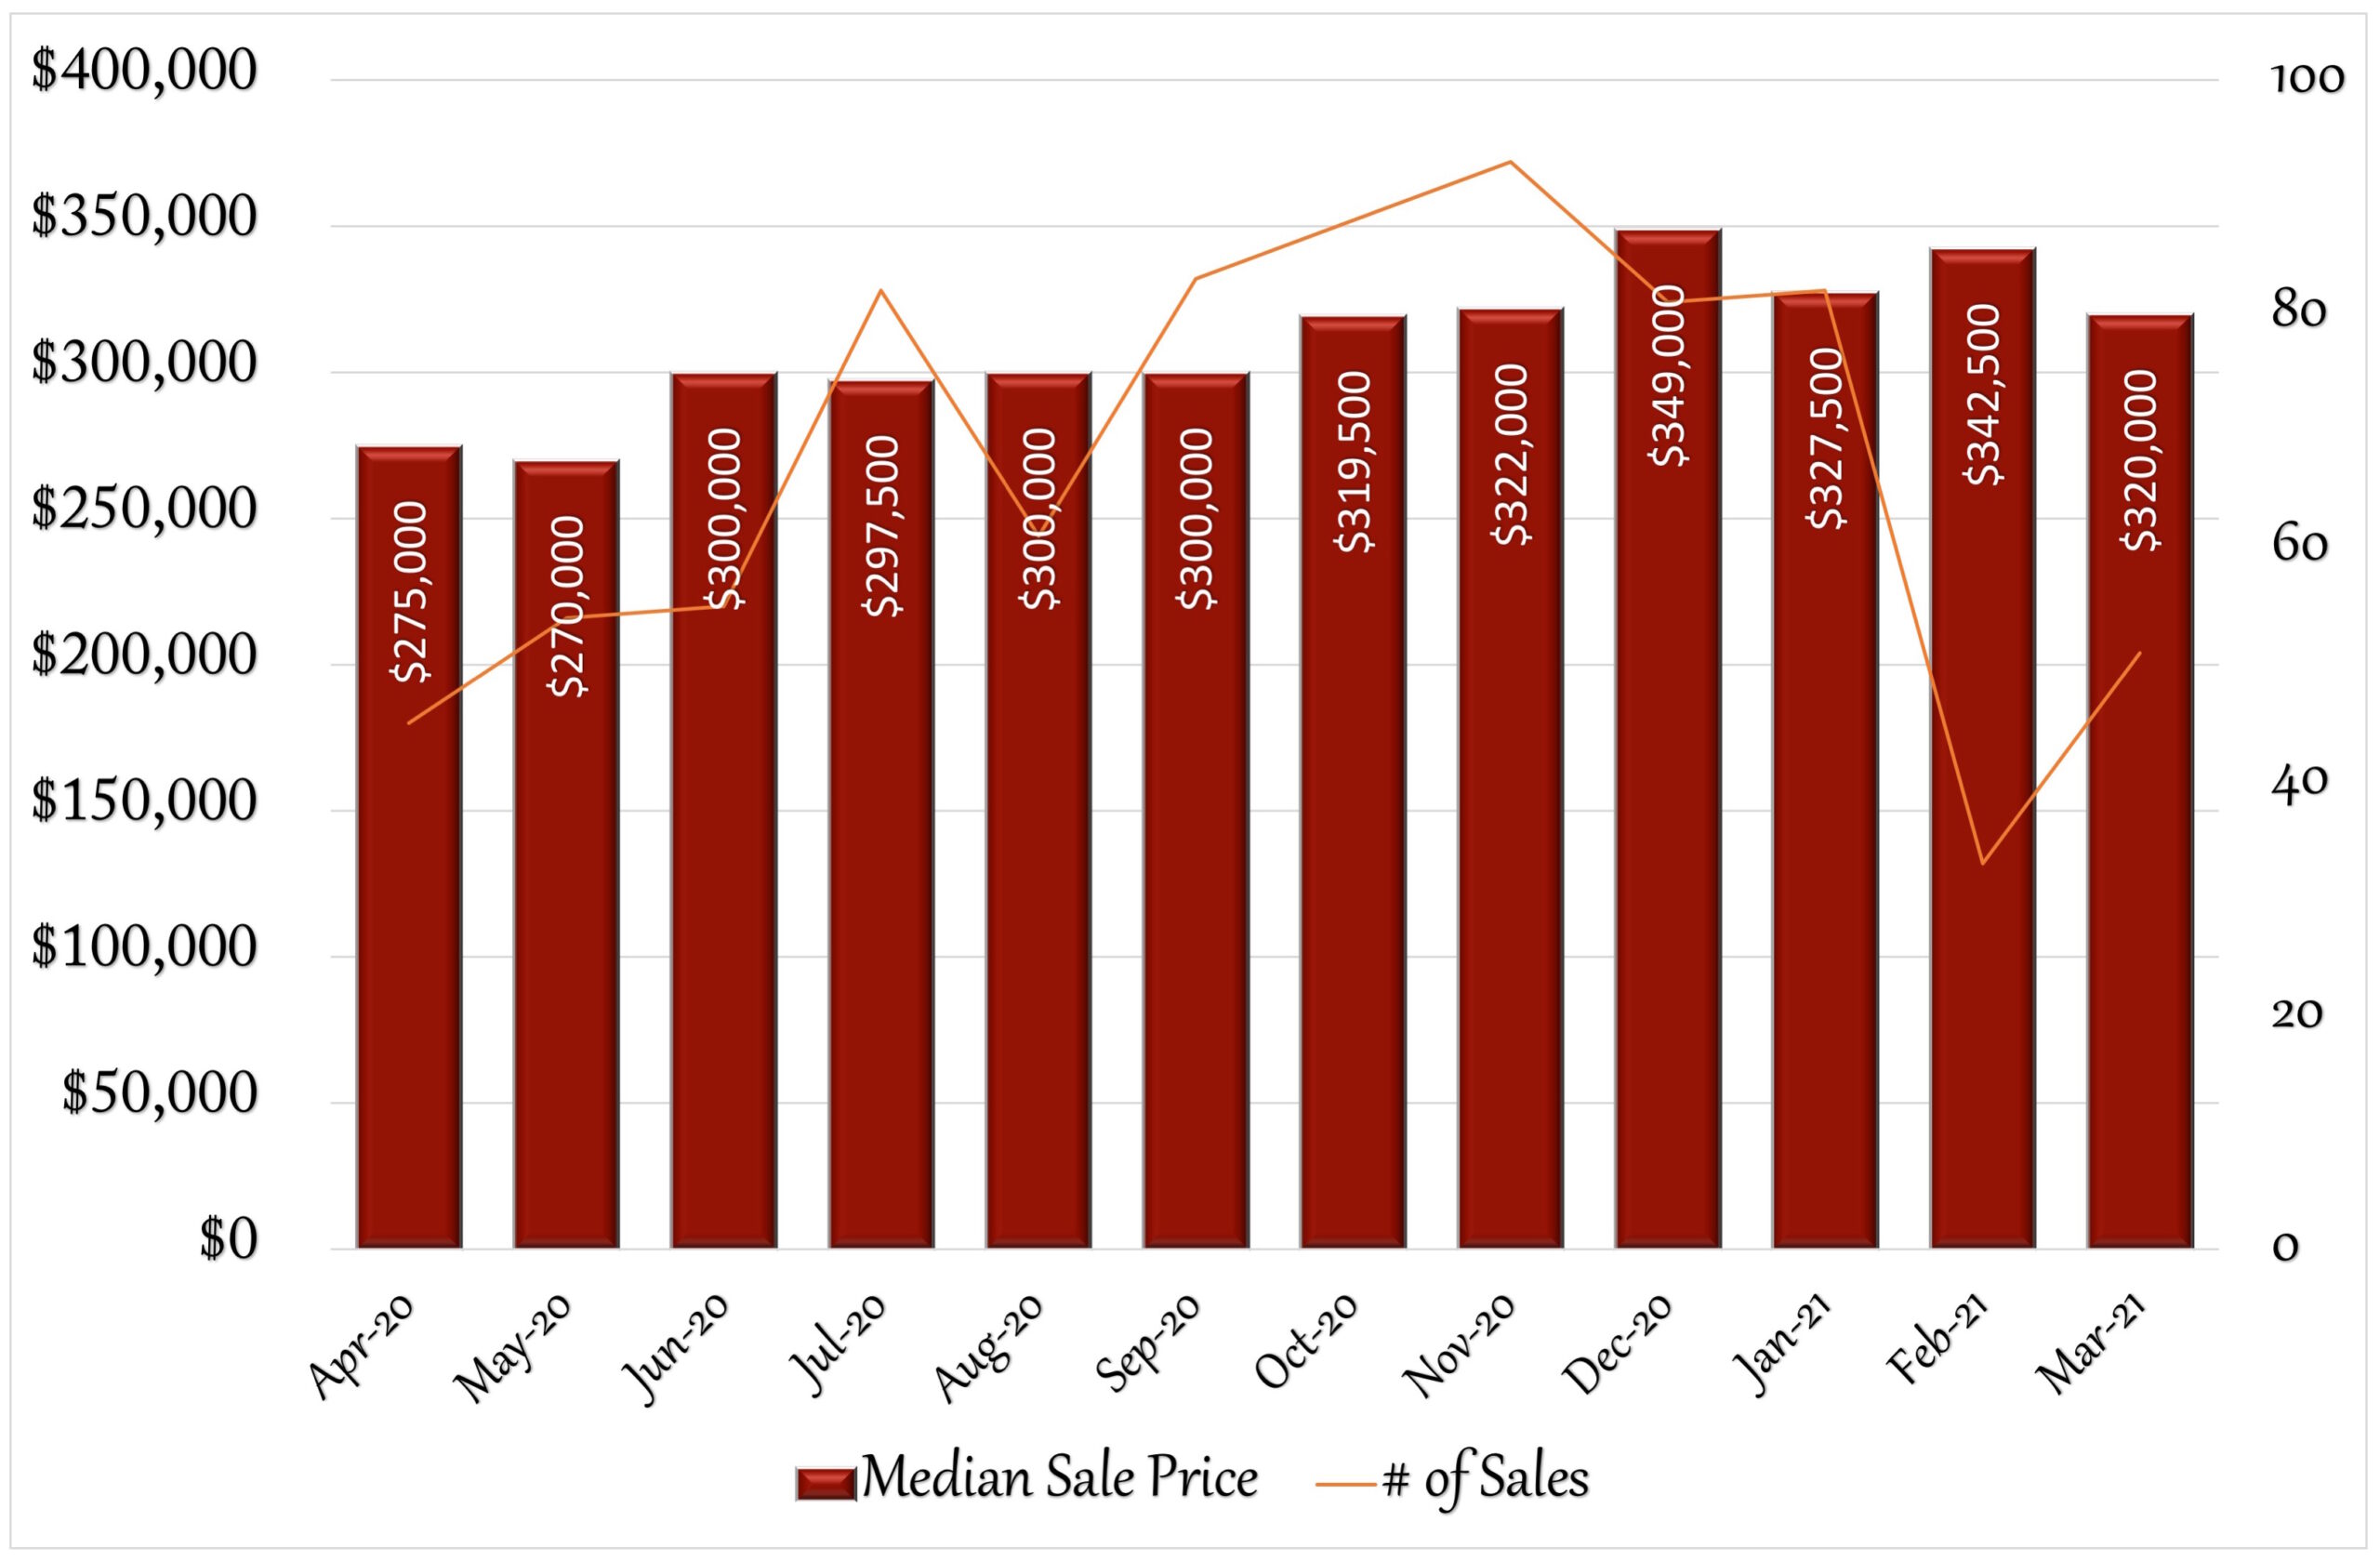
Stratford’s real estate market remained somewhat stable in March. The median sales price dropped 6.57% from $342,500 in February to $320,000 in March, on par with October and November’s prices. For the year, the median sales price is down 2.29%. With interest rates on the rise since December’s low of 2.67% (30yr fixed rate) there has been some talk about a possible coming slowdown, however in most surrounding towns, just the opposite seems to be taking place. While low inventory has plagued the real estate market for months, and still does, sellers in neighboring towns are beginning to bring more homes to the market, perhaps in anticipation of the Spring market or, perhaps to take advantage of the low interest rates before they rise further. Stratford, however, seems to be getting a late start. The number of new listings remained about the same from February. Inventory remains dramatically low to meet buyer demand. The number of houses for sale was 86 in March. Looking back at previous years, March 2018, 240, March 2019, 199, March 2020, 166, illustrates the severity of the inventory shortage and begins to explain the increases in home values over the past 12 months. Buyers are still looking for homes in Stratford, as the days on market remains relatively low at 27 days, and the % of list price to sold price remains high at 100%. By the end of March, the 30-year fixed rate reached 3.18%, prompting many buyers to move before rates increase further. This is an excellent time to sell a home in Stratford. Do you know anyone looking for more information about their real estate market? I’d be happy to help.
12 Month Sales Activity
Housing Stats
(change from previous month)
| Median Sale Price: | $320,000 |
| change: | -6.57% |
| YTD change: | -2.29% |
| Units Sold: | 51 |
| change: | 54.55% |
| Active Listings: | 86 |
| change: | 6.17% |
| New Listings: | 53 |
| change: | 1.92% |
| Days on Market: | 27 |
| change: | -25.00% |
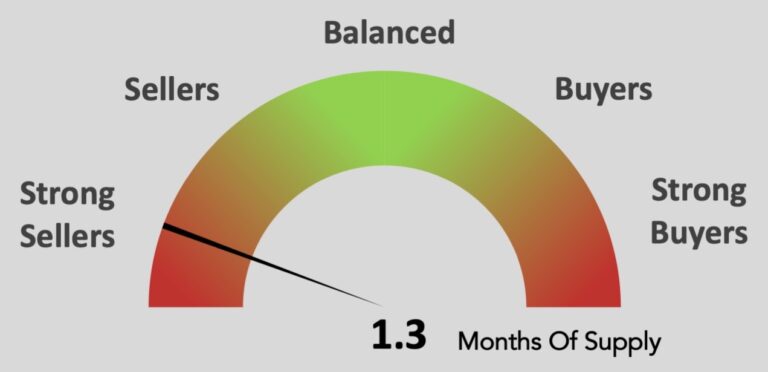
| Months of Supply: | 1.30 (Seller's Market) |
| change: | -7.14% |
Interest Rates

Market Temperature
Local Median Sales Price Trends
| Feb-21 | Mar-21 | Change | |
| Bethel | $430,000 | $462,500 | 7.56% |
| Bridgeport | $250,000 | $265,000 | 6.00% |
| Brookfield | $432,500 | $430,000 | -0.58% |
| Danbury | $357,000 | $335,000 | -6.16% |
| Easton | $612,125 | $675,250 | 10.31% |
| Fairfield | $679,000 | $725,000 | 6.77% |
| Milford | $408,000 | $380,000 | -6.86% |
| Monroe | $430,000 | $410,000 | -4.65% |
| Newtown | $465,000 | $520,000 | 11.83% |
| North Haven | $335,000 | $310,000 | -7.46% |
| Orange | $386,000 | $445,000 | 15.28% |
| Oxford | $373,250 | $360,000 | -3.55% |
| Redding | $702,500 | $768,500 | 9.40% |
| Ridgefield | $850,000 | $860,000 | 1.18% |
| Seymour | $268,000 | $305,000 | 13.81% |
| Shelton | $361,000 | $410,000 | 13.57% |
| Stratford | $343,750 | $320,000 | -6.91% |
| Trumbull | $450,000 | $480,000 | 6.67% |
| Weston | $1,212,000 | $941,250 | -22.34% |
| Westport | $1,600,000 | $1,774,500 | 10.91% |
News
How Will the Vaccine Affect Home Sales?
After COVID-19 contributed to an unparalleled hot housing market in 2020, many are wondering what the impact will be on real estate now that vaccines are being rolled out in phases. While our world won’t magically go back to pre-pandemic “normal,” there will be many positive rippling effects on the housing market, according to Realtor.com®.
While there was a significant shortage of resale homes available in 2020, that inventory is expected to slowly increase throughout 2021. As more of the population is vaccinated, Americans will feel safer about listing their homes and looking for move-up houses. Baby boomers in particular were reluctant to sell their homes during the height of the pandemic, but are more likely to move forward with downsizing.
New home construction also ramped up during the pandemic, and the chief economist for the National Association of Home Builders predicts that 1 million single-family homes and townhouses could be built this year. This will also contribute to the inventory available for home buyers.
However, an increase in seller confidence also means more buyers entering the marketplace. While properties may not go flying off the shelves as quickly as last year, buyer competition will still be a big factor in the market. In comparison to the days of 6% mortgage interest rates, even slowly increasing mortgage rates will likely hover around 3%, continuing to entice younger generations to become first-time homeowners.
The price of homes also increased in 2020, and while prices aren’t expected to decrease this year, they are expected to level off. More houses on the market means fewer bidding wars driving up prices among buyers, but the continued high demand for homes will keep prices from dropping.
This year’s real estate market will likely level off to more of a middle ground. “We’re going to settle somewhere in between where we were before COVID and where we were during COVID,” says Danielle Hale, chief economist for Realtor.com®.
Real Estate Headlines
Property Taxes Jumped in 2020: “Homeowners across the United States in 2020 got hit with the largest average property tax hike in the last four years, a sign that the cost of running local governments and public school systems rose well past the rate of inflation,” says Todd Teta, chief product officer for ATTOM Data Solutions. The latest tax numbers speak loud and clear about the continuing pressure on both recent and longtime homeowners to support the rising cost of public services.” Northeast metros tended to have the highest effective tax rates in the country. Connecticut, in the top ten highest of states, saw average tax hikes of 1.92%.
Demand for Pools, Hot Tubs Surging: New in-ground residential pools saw a 21% uptick in 2020 compared to 2019. This is historic growth for the industry—the next closest period was in 1983 with 16% growth over a much smaller base. Hot tubs are also in demand, with some areas reporting a 400% uptick. Manufacturers are reporting a six-month wait to fulfill hot tub orders. Since the pandemic, real estate professionals are reporting pools have become a major selling point. Pools also have become one of the most popular keyword searches on real estate listing sites.
NAR Survey: Design Shows Raise Buyer Expectations: Staged homes can sell faster and for more money, according to the 2021 Profile of Home Staging, a report released this week by the National Association of REALTORS®. Television shows about home design may be having an influence on buyers’ perceptions of what homes for sale should look like, the survey finds. TV design shows may lead to unrealistic expectations when house hunters go to view homes for sale. “The magic of television can make a home transformation look like it happened in a quick 60-minute time frame, which is an unrealistic standard,” says NAR President Charlie Oppler. Staged homes also may sell faster, the study says. Thirty-one percent of real estate pros said that home staging greatly decreased the amount of time a home spent on the market. The most important rooms in the house to stage, according to more than half of real estate pros surveyed: living rooms, kitchens, primary bedrooms, and dining rooms.
Americans May Prefer Investing in Homes Over Stocks: The pandemic may be shifting consumer preferences about what makes the best investment. A new study from the Federal Reserve Bank of New York asked respondents to rate which is a better investment: a home or a financial asset such as stocks? Ninety percent of respondents chose owning a primary residence over investing in the stock market. Additionally, more than 50% of survey respondents say they preferred to own a rental property over purchasing stocks. Many respondents cited housing over stocks due to the belief that real estate offers more comfort and stability. The stock market was more volatile during the initial weeks of the COVID-19 pandemic. The S&P 500 index lost over 20% in the first quarter after the outbreak struck the U.S. The stock market has largely recovered since. Strong housing appreciation and returns are also helping to lift optimism of the housing market among more Americans.
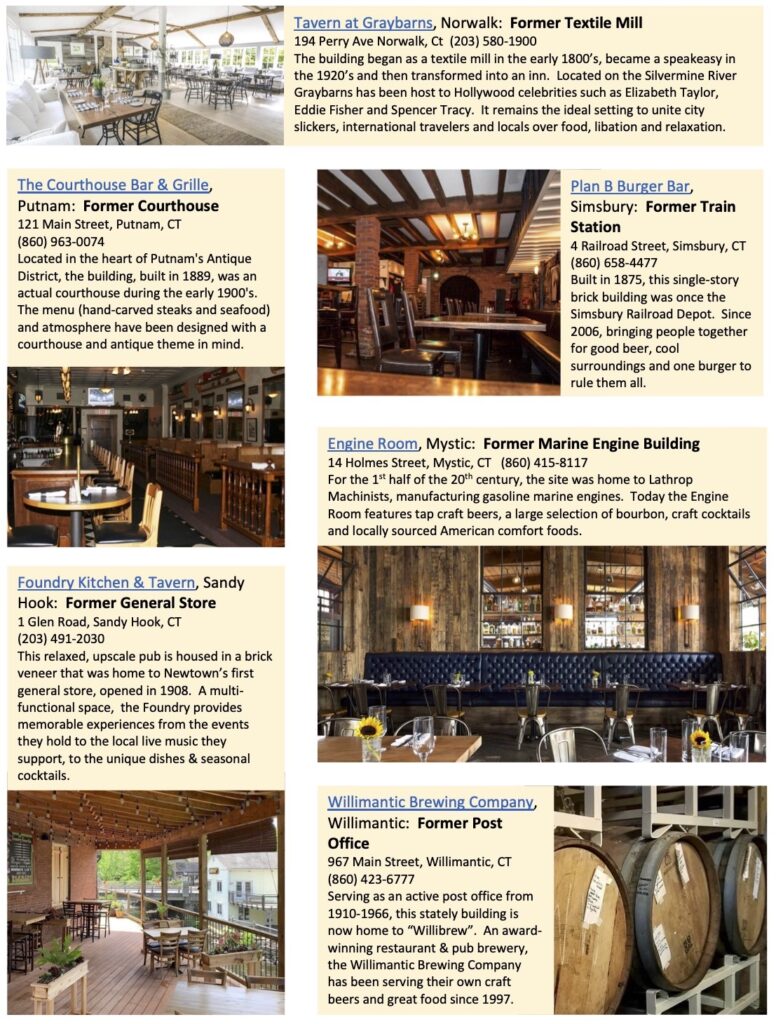
Unique CT Restaurants
With a large majority of CT residents getting vaccinated, dining out may soon be back to normal. Connecticut offers a host of truly interesting restaurant experiences in unique historic buildings, repurposed to satisfy the foodie in each of us. Ever want to dine in a former jailhouse, post office, train station or firehouse? You can, as CT offers diners all sorts of interesting landmarked venues.

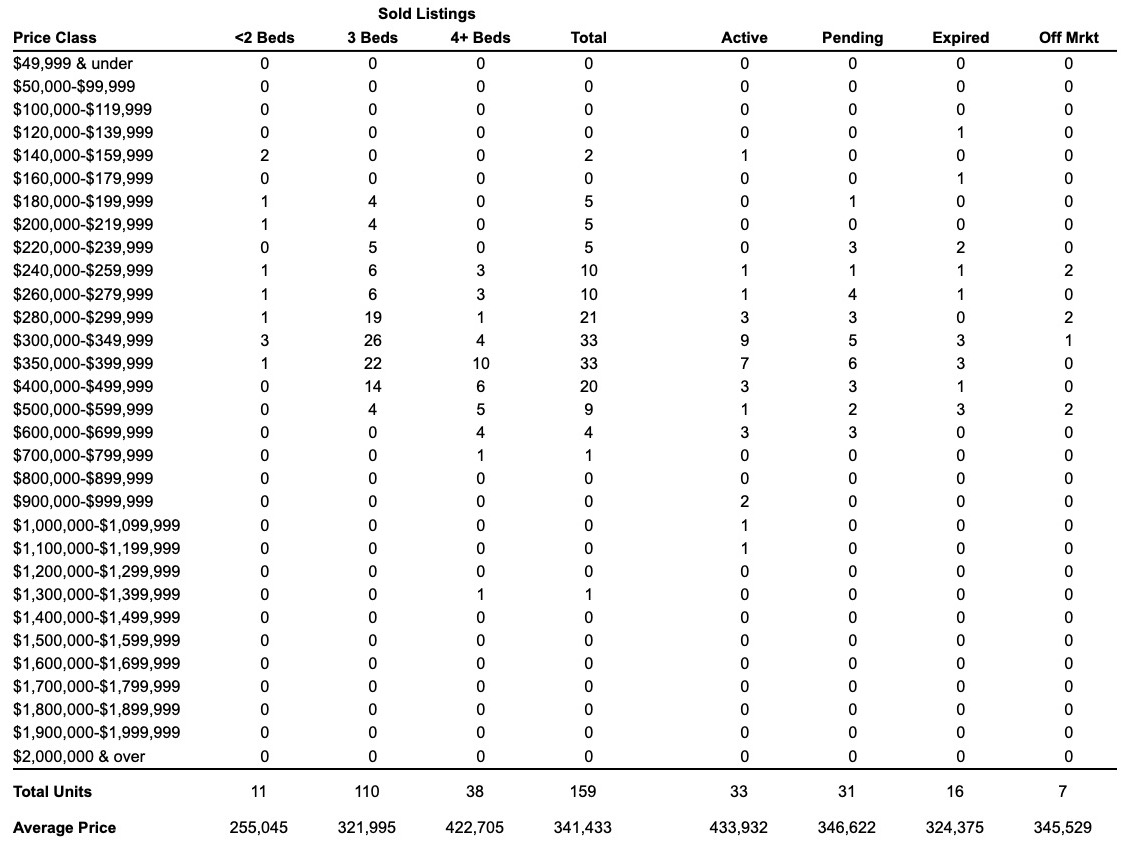
Sales Trends: January - March
March Single-Family Home Sales
(OLP: original list price • LP: list price • SP: sale price • DOM: days on market)
| Address | Style | sq ft | BR | BA (f/h) | OLP | LP | SP | SP/OLP | DOM |
| 15 Raymond St | Cape Cod | 2,067 | 3 | 1/0 | $240,000 | $240,000 | $253,540 | 106% | 1 |
| 695 Wilcoxson Ave | Colonial | 1,661 | 3 | 1/1 | $294,900 | $284,900 | $277,500 | 94% | 211 |
| 358 Windsor Ave | Colonial | 1,394 | 3 | 2/0 | $309,900 | $309,900 | $320,000 | 103% | 49 |
| 30 Baxter St | Cape Cod | 1,541 | 3 | 1/0 | $339,000 | $339,000 | $339,000 | 100% | 5 |
| 245 Tavern Rock Rd | Ranch | 1,750 | 3 | 2/0 | $359,900 | $359,900 | $379,900 | 106% | 4 |
| 65 Cedar St | Colonial | 1,900 | 3 | 2/1 | $569,000 | $499,900 | $510,000 | 90% | 53 |
| 118 2nd Ave | Contemporary | 2,828 | 5 | 3/1 | $559,000 | $559,000 | $559,000 | 100% | 139 |
| 474 Greenfield Ave | Cape Cod | 1,535 | 3 | 1/0 | $260,000 | $260,000 | $265,000 | 102% | 3 |
| 60 Disbrow St | Colonial | 1,300 | 3 | 2/0 | $269,000 | $269,000 | $279,000 | 104% | 2 |
| 171 Washington Pkwy | Colonial | 6,822 | 5 | 4/1 | $700,000 | $700,000 | $690,000 | 99% | 286 |
| 59 Legion Ave | Cape Cod | 1,739 | 3 | 2/0 | $349,000 | $349,000 | $365,500 | 105% | 53 |
| 165 Lynncrest Dr | Raised Ranch | 2,300 | 4 | 3/0 | $419,900 | $419,900 | $420,000 | 100% | 67 |
| 1911 Huntington Rd | Ranch | 4,037 | 3 | 1/1 | $399,900 | $399,900 | $427,500 | 107% | 3 |
| 106 Reitter St | Cape Cod | 2,020 | 5 | 2/0 | $379,900 | $379,900 | $371,000 | 98% | 98 |
| 787 Hawley Ln | Raised Ranch | 2,306 | 4 | 3/0 | $399,000 | $399,000 | $418,000 | 105% | 2 |
| 385 Harding Ave | Ranch | 1,724 | 4 | 2/0 | $319,000 | $299,000 | $280,000 | 88% | 128 |
| 260 Washington Pkwy | Colonial | 2,373 | 4 | 3/1 | $699,900 | $629,000 | $570,000 | 81% | 54 |
| 100 Nightingale Dr | Ranch | 1,328 | 3 | 1/1 | $349,900 | $349,900 | $365,000 | 104% | 4 |
| 961 Beaver Dam Rd | Colonial | 6,823 | 5 | 5/1 | $1,299,000 | $1,299,000 | $1,300,000 | 100% | 12 |
| 134 Albright Ave | Ranch | 1,752 | 3 | 1/0 | $329,900 | $329,900 | $320,000 | 97% | 5 |
| 504 Franklin Ave | Cape Cod | 2,139 | 3 | 1/0 | $374,000 | $374,000 | $370,000 | 99% | 5 |
| 176 Lynncrest Dr | Raised Ranch | 2,300 | 4 | 3/0 | $419,900 | $419,900 | $420,000 | 100% | 67 |
| 87 Priscilla Ln | Half Duplex | 997 | 2 | 1/0 | $149,900 | $149,900 | $153,000 | 102% | 65 |
| 166 Broadmere Rd | Cape Cod | 2,035 | 3 | 2/0 | $300,000 | $300,000 | $309,000 | 103% | 21 |
| 294 Highland Ave | Cape Cod | 2,138 | 3 | 1/0 | $375,000 | $375,000 | $402,500 | 107% | 19 |
| 376 Reitter St W. | Cape Cod | 1,319 | 3 | 1/0 | $269,900 | $269,900 | $269,000 | 100% | 31 |
| 106 Summer St | Cape Cod, Ranch | 1,267 | 3 | 1/1 | $259,900 | $259,900 | $286,100 | 110% | 1 |
| 130 Taft St | Ranch | 1,704 | 3 | 2/0 | $298,500 | $298,500 | $315,000 | 106% | 29 |
| 348 Henry Ave | Half Duplex | 1,134 | 3 | 1/1 | $224,900 | $224,900 | $220,000 | 98% | 9 |
| 1331 Success Ave | Half Duplex | 1,944 | 3 | 1/1 | $249,000 | $249,000 | $249,000 | 100% | 4 |
| 7445 Main St | Colonial | 1,288 | 3 | 1/0 | $249,900 | $249,900 | $250,000 | 100% | 21 |
| 173 Stonybrook Rd | Cape Cod | 2,330 | 4 | 2/1 | $299,000 | $299,000 | $299,000 | 100% | 33 |
| 200 Wainwright Pl | Cape Cod | 2,790 | 3 | 1/0 | $354,900 | $337,500 | $338,505 | 95% | 102 |
| 310 Ferndale Ave | Contemporary, Split Level | 1,217 | 3 | 2/0 | $335,000 | $335,000 | $380,000 | 113% | 23 |
| 295 2nd Ave | Cape Cod | 2,510 | 3 | 2/0 | $395,000 | $395,000 | $395,000 | 100% | 9 |
| 195 Knollwood Dr | Ranch | 1,890 | 3 | 2/0 | $439,000 | $439,000 | $490,900 | 112% | 12 |
| 180 Knowlton St | Half Duplex | 1,824 | 3 | 1/1 | $229,900 | $209,000 | $205,000 | 89% | 143 |
| 412 Barnum Terrace Ext | Ranch | 1,052 | 3 | 1/0 | $156,000 | $156,000 | $210,000 | 135% | 17 |
| 85 Frash St | Half Duplex | 1,218 | 3 | 1/1 | $225,000 | $225,000 | $220,000 | 98% | 27 |
| 215 Kenyon St | Cape Cod | 1,403 | 4 | 1/0 | $234,900 | $234,900 | $250,000 | 106% | 4 |
| 214 Washington Pkwy | Cape Cod | 3,070 | 4 | 2/0 | $399,900 | $379,000 | $365,000 | 91% | 99 |
| 35 Red Fox Rd | Ranch | 2,668 | 3 | 1/1 | $399,000 | $375,000 | $375,000 | 94% | 98 |
| 174 Terrill Rd | Ranch | 1,056 | 3 | 1/0 | $289,900 | $289,900 | $290,000 | 100% | 84 |
| 76 Yarwood St | Colonial | 1,488 | 3 | 2/0 | $309,900 | $299,900 | $314,150 | 101% | 69 |
| 706 Freeman Ave | Cape Cod | 1,596 | 3 | 2/0 | $359,900 | $349,900 | $350,000 | 97% | 52 |
| 35 Shaw St | Cape Cod | 2,520 | 5 | 2/0 | $425,000 | $425,000 | $400,000 | 94% | 16 |
| 66 Larkin Ct | Half Duplex | 1,082 | 2 | 1/0 | $159,500 | $159,500 | $150,000 | 94% | 49 |
| 115 Streckfus Rd | Cape Cod | 1,114 | 4 | 1/0 | $255,000 | $255,000 | $250,000 | 98% | 6 |
| 273 Garibaldi Ave | Ranch | 1,324 | 3 | 2/0 | $235,000 | $215,000 | $215,000 | 91% | 149 |
| 35 Repko Cir | Colonial | 3,271 | 5 | 3/1 | $600,000 | $600,000 | $620,000 | 103% | 52 |
| 1192 North Ave | Cape Cod | 1,131 | 3 | 2/0 | $275,000 | $275,000 | $290,000 | 105% | 13 |
| Units Sold: 51 | $329,900 | $329,900 | $320,000 | 100% | 27 |
Are You Interested In A Real Estate Review?