Serving New Haven and Fairfield Counties | Contact: (203) 895-2783
Menu
Menu
Fairfield Market Report August 2021
Market Overview
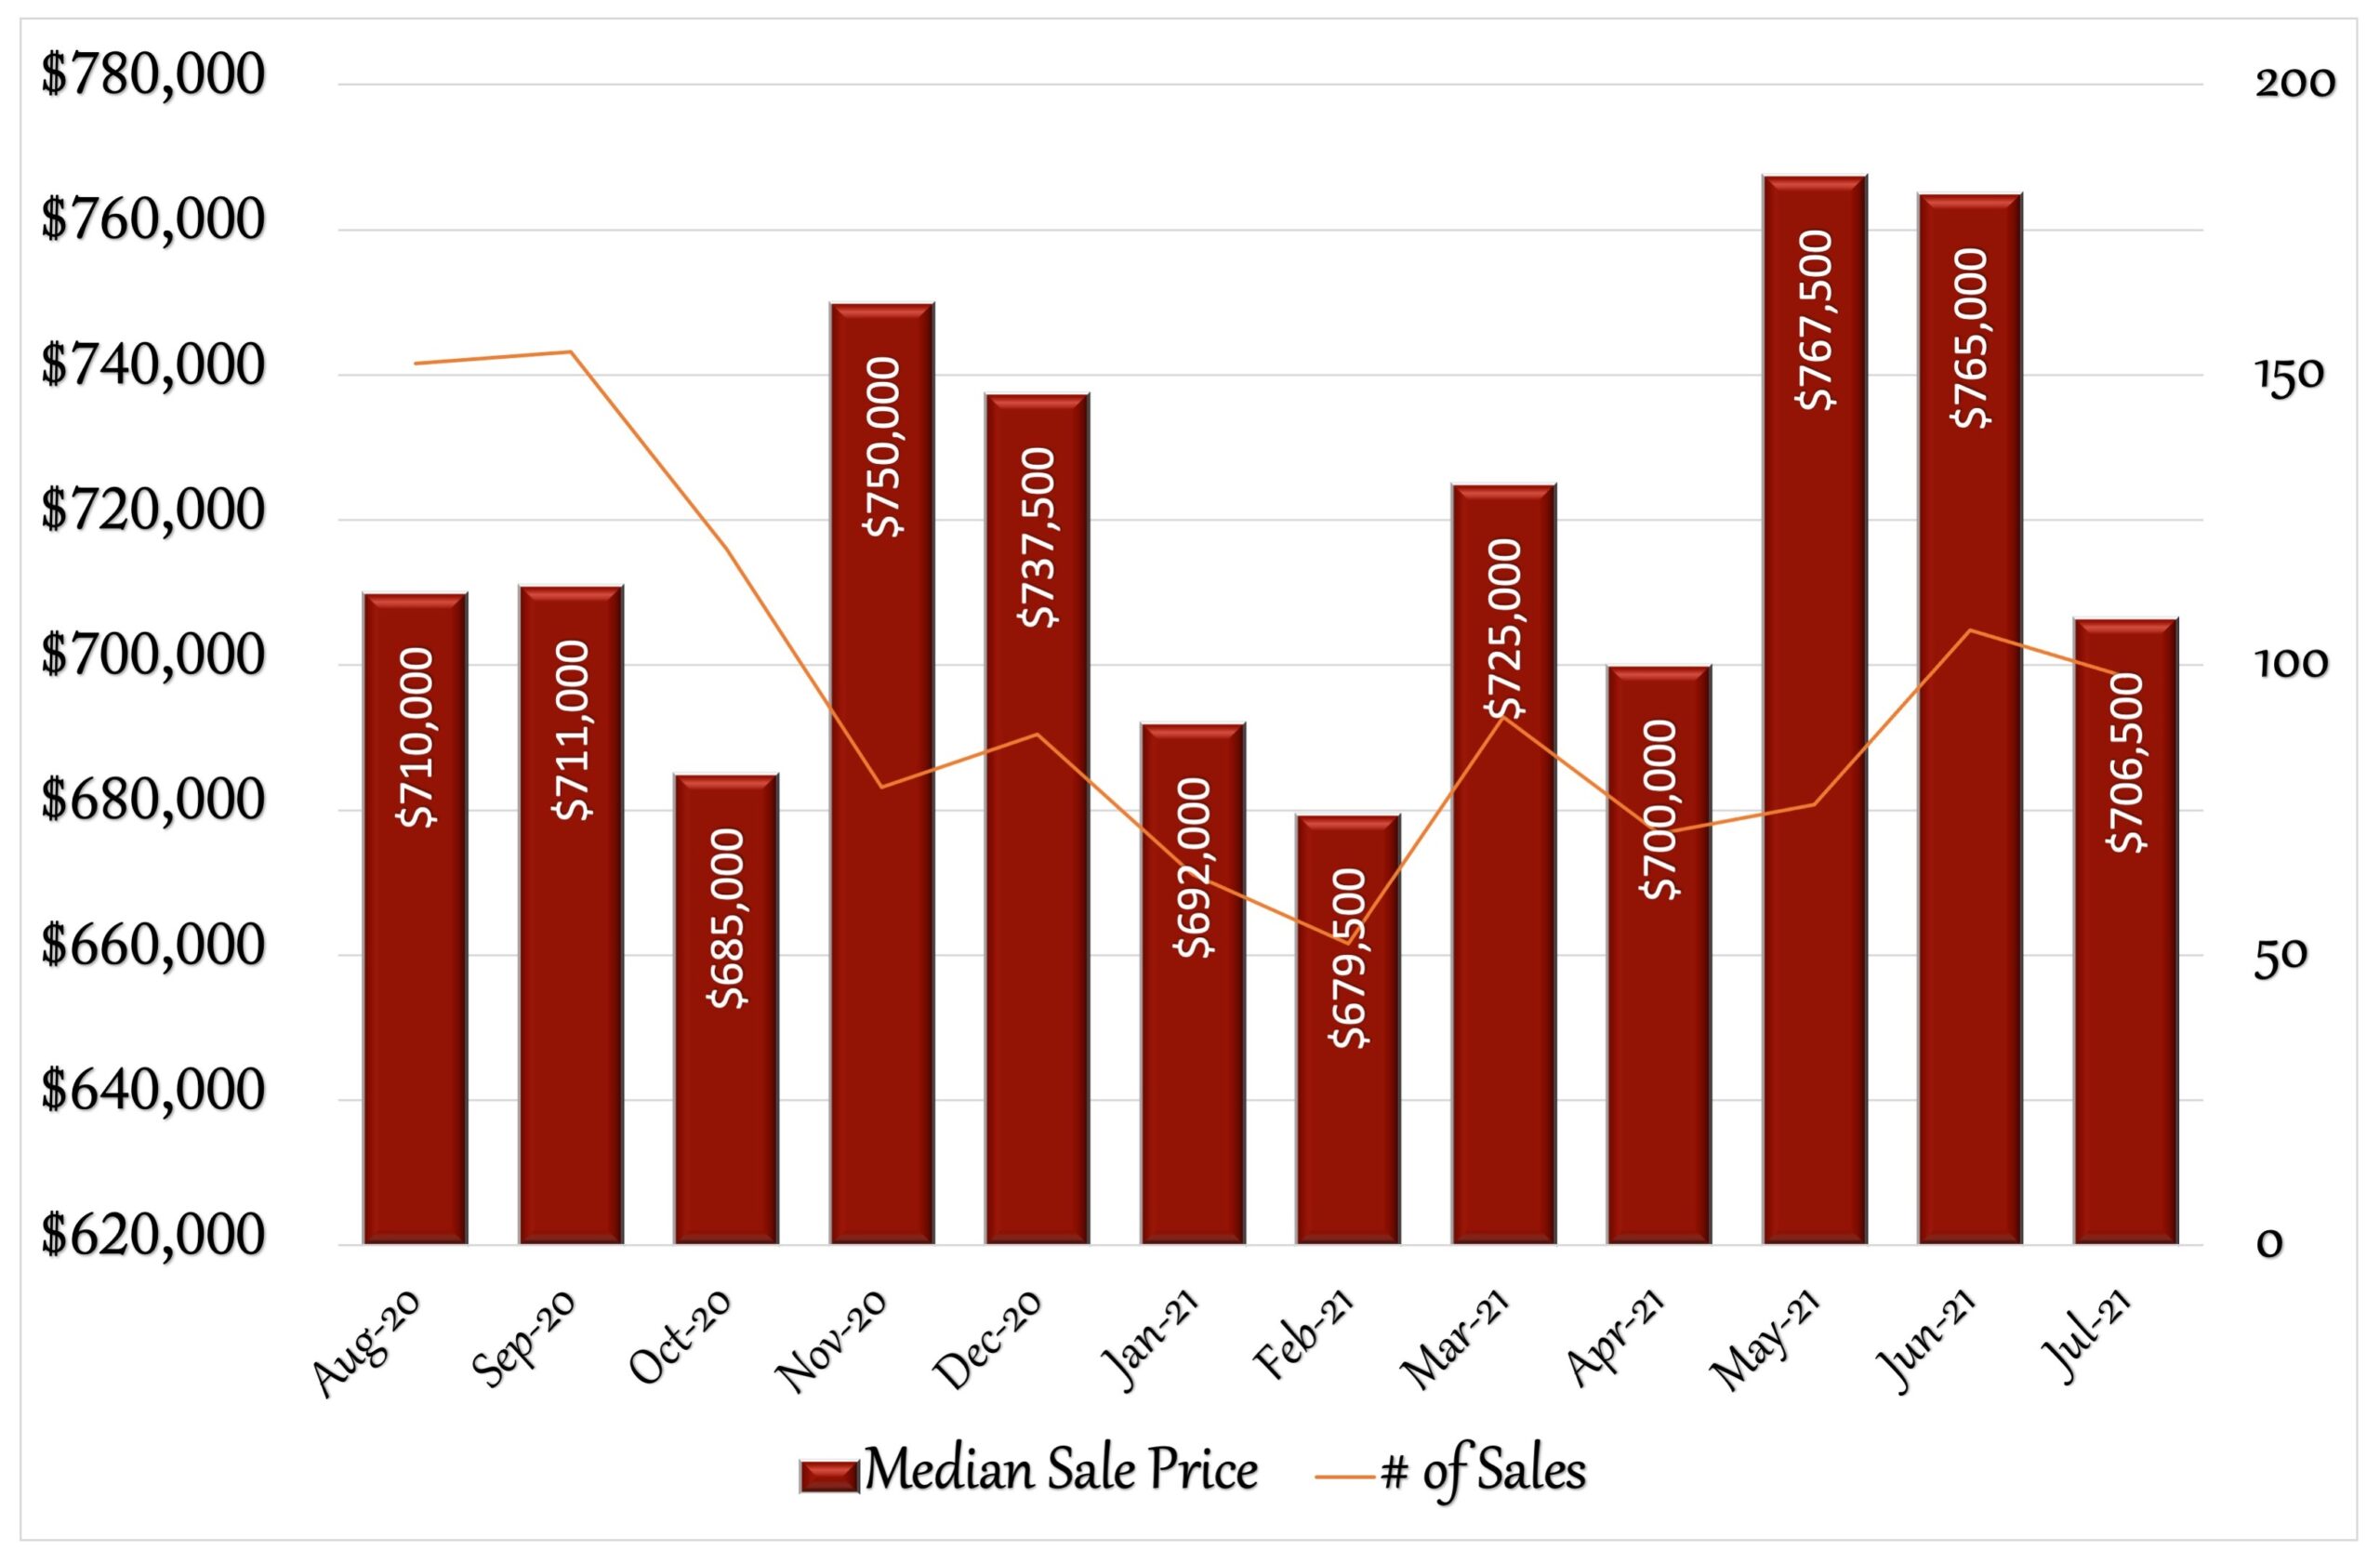
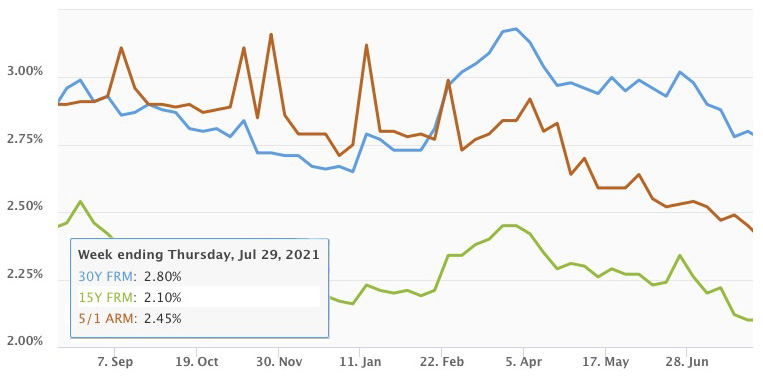
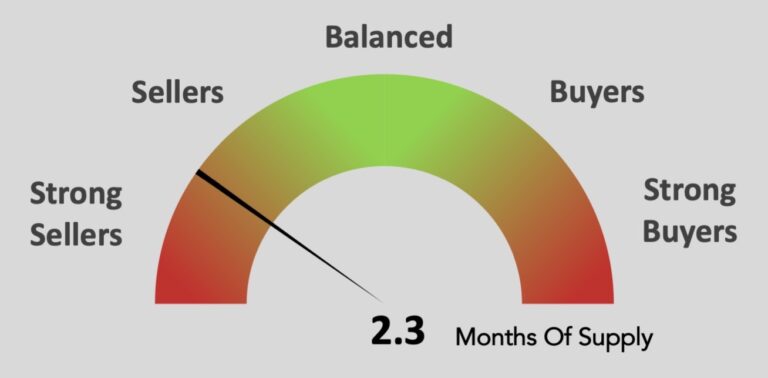
Fairfield’s real estate market experienced a slowdown in July. After several months with up and down home prices, July saw a 7% drop in single family homes median sales price, from $765,000 to $706,500. That puts home values up 2.1% since January. Other statistics pointed to a slowdown as well. The number of houses sold dropped from 106 in June to 98 in July. The number of new listings in July was also lower than those in June: 91 vs. 108. It took longer to sell a house in July than the previous month by 9 days. Fairfield is still well in sellers-market territory, as the months of inventory is 2.3, slightly more favorable to sellers than in June. Historically, July has seen increases in Fairfield’s sales prices over June, with increases in 2018, 2019 and 2020. Even with the lower median sales price, sellers on average received 100.3% of asking price. The decrease in new listings may also indicate sellers caution as the Delta variant of the Corona Virus begins to become the dominant strain. Although pending sales point to another slow month for August, buyers are still looking for houses in Fairfield. Interest rates continue to be extremely favorable at 2.8% for a 30 year fixed rate by the end of July. Rates have been below 3% for the past 4 months. For anyone considering a move, this is still a great time to sell a house in Easton. Do you know anyone looking for more information about their real estate market? I’d be happy to help.
12 Month Sales Activity
Housing Stats
(change from previous month)
| Median Sale Price: | $706,500 |
| change: | -7.65% |
| YTD change: | 2.10% |
| Units Sold: | 98 |
| change: | -7.55% |
| Active Listings: | 210 |
| change: | -8.30% |
| New Listings: | 91 |
| change: | -15.74% |
| Days on Market: | 38 |
| change: | 31.03% |
| Months of Supply: | 2.30 (Seller's Market) |
| change: | -4.17% |
Interest Rates
Market Temperature
Local Real Estate Price Trends
| Jun-21 | Jul-21 | Change | |
| Bethel | $515,000 | $500,000 | -2.91% |
| Bridgeport | $300,500 | $325,000 | 8.15% |
| Brookfield | $540,000 | $437,500 | -18.98% |
| Danbury | $447,500 | $400,000 | -10.61% |
| Easton | $889,450 | $682,000 | -23.32% |
| Fairfield | $765,000 | $706,500 | -7.65% |
| Milford | $432,500 | $404,500 | -6.47% |
| Monroe | $505,000 | $511,000 | 1.19% |
| Newtown | $572,500 | $500,000 | -12.66% |
| N. Haven | $342,500 | $438,500 | 28.03% |
| Orange | $461,500 | $500,000 | 8.34% |
| Oxford | $447,500 | $510,000 | 13.97% |
| Redding | $750,000 | $640,000 | -14.67% |
| Ridgefield | $757,500 | $875,000 | 15.51% |
| Seymour | $277,500 | $325,000 | 17.12% |
| Shelton | $419,900 | $442,500 | 5.38% |
| Stratford | $373,000 | $362,500 | -2.82% |
| Trumbull | $518,000 | $507,500 | -2.03% |
| Weston | $1,162,500 | $1,145,500 | -1.46% |
| Westport | $1,628,000 | $1,557,500 | -4.33% |
Tips
The Value of Using an Agent in Today’s Market
In an age where all the information we could possibly need is at our fingertips, many people have embraced a DIY lifestyle. But when it comes to real estate, it’s better to leave it to the pros. While saving commissions may seem appealing, you could end up losing time, money and bargaining power without a real estate agent’s expertise.
Why Do You Need a Real Estate Agent?
- An agent will devise a marketing plan specific to your home and will utilize their network to advertise your home to an audience you wouldn’t likely reach on your own.
- Agents are knowledgeable on the laws and regulations of the industry. Having an agent on your side can save you from legal troubles.
- Agents understand the market and can price your house to sell. They are also skilled negotiators that can get top dollar for your home.
Top 5 Home Improvements
Looking into home renovations? Here are the five improvements that will reward you the greatest ROI, according to RISMedia.com.
- As an eye-catching feature, garage door replacements boast the best ROI (94% of the cost) at resale time, especially with a strategic design that complements your home’s architectural style.
- Manufactured stone veneer is a high-reward, affordable siding material that can enhance both the curb appeal and interior design of your house.
- To maximize kitchen remodeling, opt for mid-range changes like refacing or replacing cabinets and countertops, updating fixtures and hardware, and/or replacing appliances.
- If stone veneer isn’t for you, try fiber cement siding for surfacing that looks like authentic wood but isn’t prone to warping and rotting.
- Window replacements will serve both your home’s aesthetic appeal as well as its energy efficiency.
Real Estate Headlines
Bidding War Winners Are Getting Cold Feet: Some home buyers are reportedly backing out of purchase contracts due to second-guessing the contract price, after winning a bidding war. The trend is most common in the Northeast and Mountain regions of the country. After losing out in several multiple offer situations, a buyer may head into a new bidding war with an “I’ll offer anything” attitude. After the jubilance of winning wears off, the reality of overpaying sets in. Many develop cold feet and back out of the contract, thus putting the now stigmatized house back on the market.
Sales of $1M-Plus Homes Soar: Unlike past housing booms, the real estate market is seeing a surge in sales at the very top of the housing market. More expensive properties are selling nearly twice as fast as lower and mid-priced homes. “Wealthier Americans have benefited greatly during the pandemic thanks to the rising stock market, which typically helps grow net wealth,” Lawrence Yun, chief economist at the National Association of REALTORS®, told The Washington Post. “So there’s greater demand for luxury housing now and that sector isn’t as hamstrung by inventory shortages as the rest of the market.”
MLS Finds That Listed Homes Sell for 17% More: In a two-year analysis, homes on a mid-Atlantic MLS sold for more money than similar homes that sold off of it. Bright MLS, a multiple listing service from Pennsylvania to Virginia, conducted the study of 442,829 records for home sales transactions completed between January 2019 and December 2020. The median sold on the MLS was about 17% higher than homes sold off of the MLS, through for sale by owner. The study found that the fastest sales for the most money use the MLS to market the homes for sale.
30-Year Mortgage Rate Dips to 2.77%: New fears over the fast-spreading COVID-19 delta variant are moving mortgage rates lower. The 30-year fixed-rate mortgage spent another week under 3%.
Delta Variant Could Cause Housing Volatility: The fast-spreading delta variant of the coronavirus is prompting more pandemic precautions to return. It’s also affecting the hot housing market and likely will continue to be housing’s wild card over the next few months, economists say. The fears of a more contagious version of the coronavirus could prompt some homeowners to delay selling their home, which would press on inventory levels just as they were starting to see some improvement. If buyer demand stays high and inventories fall again, that could then press on home prices even more and ignite more bidding wars for limited housing stock.
Upcoming Events
Connecticut’s event schedule is back this Summer, with outdoor concerts, plays, festivals, craft shows and more. So grab the family, hit the road and enjoy some of the area’s great fun filled events.
Sales Trends
July Single-Family Home Sales
(OLP: original list price • LP: list price • SP: sale price • DOM: days on market)
| Address | Style | sq ft | BR | BA (f/h) | OLP | LP | SP | SP/OLP | DOM |
| 324 Villa Ave | Cape Cod | 1,009 | 2 | 1/1 | $359,000 | $359,000 | $325,000 | 91% | 40 |
| 20 Reid St | Split Level | 1,822 | 3 | 1/1 | $585,000 | $525,000 | $486,500 | 83% | 37 |
| 20 Homeland St | Split Level | 1,934 | 3 | 2/0 | $479,500 | $479,500 | $520,000 | 108% | 64 |
| 2976 Black Rock Tpke | Cape Cod | 1,965 | 3 | 2/0 | $525,000 | $525,000 | $525,000 | 100% | 63 |
| 367 Toll House Ln | Colonial | 2,419 | 4 | 2/1 | $669,000 | $649,000 | $630,000 | 94% | 80 |
| 324 Steiner St | Colonial | 1,500 | 4 | 1/1 | $650,000 | $650,000 | $650,000 | 100% | 65 |
| 133 Cardinal St | Colonial | 2,498 | 5 | 2/1 | $650,000 | $650,000 | $657,500 | 101% | 2 |
| 450 Riverside Dr | Cape Cod | 1,613 | 3 | 2/0 | $649,000 | $649,000 | $684,000 | 105% | 63 |
| 983 Congress St | Cape Cod, Colonial | 4,090 | 3 | 2/1 | $849,900 | $699,900 | $700,000 | 82% | 79 |
| 132 Shelter Rock Rd | Colonial | 1,600 | 4 | 2/1 | $600,000 | $600,000 | $703,000 | 117% | 65 |
| 142 Oldfield Rd | Colonial | 2,111 | 3 | 2/0 | $775,000 | $775,000 | $799,000 | 103% | 27 |
| 178 Taintor Dr | Colonial | 3,197 | 5 | 4/1 | $1,399,000 | $1,299,000 | $1,300,000 | 93% | 55 |
| 371 Orchard Hill Ln | Colonial | 4,820 | 5 | 3/1 | $1,449,000 | $1,449,000 | $1,530,000 | 106% | 25 |
| 275 Lalley Blvd | Colonial | 3,577 | 4 | 3/2 | $1,879,000 | $1,879,000 | $1,840,000 | 98% | 16 |
| 206 School St | Colonial, Farm House | 1,360 | 3 | 1/1 | $437,500 | $437,500 | $480,000 | 110% | 18 |
| 927 S. Pine Creek Rd | Cape Cod | 1,705 | 3 | 2/0 | $674,000 | $674,000 | $686,000 | 102% | 12 |
| 1495 Westport Tpke | Colonial, Farm House | 3,227 | 4 | 3/1 | $1,100,000 | $1,100,000 | $1,050,000 | 95% | 29 |
| 524 Sturges Rd | Colonial, Farm House | 6,018 | 5 | 3/2 | $2,195,000 | $2,195,000 | $2,200,000 | 100% | 18 |
| 1451 Fairfield Woods Rd | Cape Cod | 1,538 | 3 | 2/0 | $449,900 | $449,900 | $501,000 | 111% | 21 |
| 118 Papermill Ln | Ranch | 1,382 | 2 | 1/0 | $524,000 | $524,000 | $540,000 | 103% | 66 |
| 160 Windermere St | Ranch | 2,934 | 4 | 2/0 | $659,000 | $659,000 | $650,000 | 99% | 35 |
| 86 Chatham Rd | Colonial | 3,878 | 4 | 2/1 | $815,000 | $815,000 | $865,000 | 106% | 68 |
| 105 Homefair Dr | Cape Cod, Colonial | 3,247 | 5 | 3/1 | $925,000 | $925,000 | $972,000 | 105% | 54 |
| 200 Longmeadow Rd | Colonial | 5,183 | 3 | 2/1 | $985,000 | $985,000 | $999,000 | 101% | 14 |
| 62 Marlborough Ter | Ranch | 904 | 2 | 1/0 | $375,000 | $375,000 | $362,000 | 97% | 27 |
| 120 Marne Ave | Colonial | 1,620 | 3 | 2/0 | $529,900 | $529,900 | $554,000 | 105% | 66 |
| 30 Jackman Ave | Colonial | 2,067 | 3 | 3/0 | $599,000 | $599,000 | $630,000 | 105% | 21 |
| 149 Country Rd | Ranch | 1,539 | 3 | 2/0 | $565,000 | $565,000 | $560,000 | 99% | 43 |
| 138 Sunnyridge Ave | Cape Cod | 1,197 | 3 | 1/0 | $399,900 | $399,900 | $410,000 | 103% | 48 |
| 50 Edison Ave | Half Duplex | 2,621 | 4 | 2/1 | $525,000 | $525,000 | $530,000 | 101% | 65 |
| 194 Ludlowe Rd | Colonial | 1,476 | 3 | 1/1 | $599,000 | $559,000 | $550,000 | 92% | 103 |
| 239 N. Pine Creek Rd | Colonial | 1,341 | 3 | 1/1 | $550,000 | $550,000 | $575,000 | 105% | 45 |
| 245 N. Cedar Rd | Colonial | 2,486 | 4 | 2/1 | $1,199,900 | $1,199,900 | $1,260,000 | 105% | 23 |
| 208 Old Mill Rd | Colonial | 4,469 | 4 | 3/1 | $1,399,000 | $1,399,000 | $1,515,000 | 108% | 64 |
| 90 Mill Hill Ln | Colonial, Other | 2,884 | 4 | 3/1 | $1,750,000 | $1,750,000 | $1,750,000 | 100% | 2 |
| 283 Euclid Ave | Colonial | 1,260 | 3 | 1/1 | $499,900 | $499,900 | $530,000 | 106% | 12 |
| 201 Old Mill Rd | Colonial | 2,859 | 5 | 3/1 | $995,000 | $995,000 | $1,020,000 | 103% | 34 |
| 16 Osborne Ln | Colonial | 2,832 | 4 | 3/1 | $1,184,000 | $1,099,000 | $1,105,500 | 93% | 53 |
| 59 Mona Ter | Colonial | 3,450 | 4 | 3/1 | $1,349,000 | $1,399,000 | $1,600,000 | 119% | 76 |
| 18 Revere Ln, Unit #18 | Colonial, Contemporary | 2,706 | 3 | 2/1 | $819,000 | $819,000 | $820,000 | 100% | 12 |
| 40 Pope St | Colonial | 2,867 | 4 | 2/1 | $694,900 | $694,900 | $694,900 | 100% | 0 |
| 613 S. Benson Rd | Ranch | 1,322 | 2 | 2/0 | $729,000 | $699,000 | $697,000 | 96% | 40 |
| 91 Tide Mill Ter | Colonial | 2,080 | 4 | 2/1 | $1,025,000 | $1,025,000 | $1,051,190 | 103% | 12 |
| 135 Tuller Rd | Cape Cod | 1,495 | 3 | 2/1 | $670,000 | $649,000 | $639,500 | 95% | 47 |
| 347 High Ridge Rd | Cape Cod | 1,750 | 4 | 3/0 | $650,000 | $650,000 | $660,000 | 102% | 45 |
| 1341 Bronson Rd | Colonial, Farm House | 2,800 | 4 | 3/1 | $1,099,000 | $1,099,000 | $1,200,000 | 109% | 39 |
| 267 S. Pine Creek Rd | Cape Cod, Bungalow | 972 | 2 | 1/0 | $409,500 | $409,500 | $435,000 | 106% | 40 |
| 1566 Stratfield Rd | Cape Cod | 1,210 | 3 | 2/0 | $459,000 | $459,000 | $455,000 | 99% | 18 |
| 67 Flora Blvd | Cape Cod | 1,237 | 4 | 1/0 | $649,000 | $649,000 | $610,000 | 94% | 76 |
| 66 Meadowcrest Dr | Ranch, Split Level | 4,218 | 3 | 2/1 | $599,000 | $599,000 | $650,000 | 109% | 33 |
| 261 Old Post Rd | Colonial | 2,192 | 4 | 2/0 | $889,000 | $889,000 | $890,000 | 100% | 18 |
| 52 Romanock Pl | Cape Cod | 1,901 | 4 | 2/0 | $649,000 | $619,000 | $619,000 | 95% | 67 |
| 180 Oldfield Dr | Ranch | 1,542 | 3 | 2/0 | $965,000 | $895,500 | $765,000 | 79% | 42 |
| 406 N. Benson Rd | Colonial | 1,812 | 4 | 2/0 | $775,000 | $775,000 | $765,000 | 99% | 15 |
| 39 Michaela Cir | Colonial | 2,636 | 4 | 2/1 | $999,000 | $999,000 | $1,020,000 | 102% | 20 |
| 171 Ridge Cmn | Contemporary | 3,970 | 4 | 3/2 | $1,295,000 | $1,295,000 | $1,250,000 | 97% | 39 |
| 110 Farmstead Hill Rd | Colonial | 6,523 | 5 | 5/2 | $2,495,000 | $2,250,000 | $2,100,000 | 84% | 57 |
| 166 Northwood Rd | Colonial | 3,248 | 3 | 2/1 | $879,000 | $879,000 | $933,333 | 106% | 20 |
| 193 Sky Top Ter | Ranch | 6,418 | 6 | 5/1 | $939,000 | $939,000 | $945,000 | 101% | 62 |
| 10 Sleepy Hollow Rd | Colonial, Modern | 3,000 | 4 | 3/1 | $1,250,000 | $1,250,000 | $1,220,000 | 98% | 40 |
| 402 Sasco Hill Rd | Colonial | 7,956 | 7 | 8/2 | $6,500,000 | $6,500,000 | $6,200,000 | 95% | 74 |
| 56 Rugby Rd | Bungalow | 401 | 1 | 1/0 | $324,900 | $324,900 | $300,000 | 92% | 107 |
| 156 Buena Vista Rd | Colonial | 1,480 | 3 | 2/0 | $549,000 | $549,000 | $535,000 | 97% | 70 |
| 687 Stratfield Rd | Colonial, Farm House | 1,867 | 3 | 2/1 | $450,000 | $450,000 | $450,000 | 100% | 0 |
| 781 Valley Rd | Cape Cod | 2,118 | 3 | 3/0 | $599,000 | $599,000 | $599,000 | 100% | 51 |
| 593 Towne House Rd | Colonial | 3,258 | 4 | 2/1 | $969,000 | $969,000 | $980,000 | 101% | 34 |
| 325 Wood House Rd | Colonial | 4,376 | 5 | 5/1 | $1,225,000 | $1,225,000 | $1,255,000 | 102% | 22 |
| 131 Colony St | Colonial | 1,344 | 3 | 1/1 | $439,000 | $439,000 | $445,000 | 101% | 22 |
| 335 Oakwood Dr | Split Level | 1,592 | 3 | 1/1 | $479,000 | $479,000 | $468,000 | 98% | 38 |
| 200 Autumn Ridge Rd | Ranch | 2,424 | 3 | 2/1 | $500,000 | $500,000 | $492,500 | 99% | 12 |
| 94 Farist Rd | Ranch | 2,398 | 3 | 3/0 | $600,000 | $600,000 | $600,000 | 100% | 28 |
| 152 London Ter | Colonial, Contemporary | 3,740 | 4 | 3/1 | $725,000 | $725,000 | $765,000 | 106% | 43 |
| 67 Shady Hill Rd | Colonial | 1,902 | 4 | 2/1 | $725,000 | $725,000 | $785,000 | 108% | 5 |
| 114 Brookmere Dr | Colonial | 3,191 | 4 | 2/1 | $899,000 | $899,000 | $965,000 | 107% | 17 |
| 1133 Cedar Rd | Colonial | 6,308 | 5 | 5/1 | $2,799,000 | $2,799,000 | $2,650,000 | 95% | 44 |
| 44 Brookfield Ave | Colonial | 1,545 | 3 | 1/1 | $425,000 | $425,000 | $480,000 | 113% | 79 |
| 166 Bailey Rd | Split Level | 3,576 | 5 | 3/0 | $799,000 | $799,000 | $762,500 | 95% | 15 |
| 50 Forest Ave | Cape Cod | 2,095 | 4 | 2/0 | $799,000 | $799,000 | $850,000 | 106% | 34 |
| 43 Palamar Dr | Colonial | 2,186 | 3 | 1/1 | $629,900 | $629,900 | $652,000 | 104% | 16 |
| 1084 Sturges Hwy | Colonial, Georgian Colonial | 8,263 | 6 | 8/1 | $2,200,000 | $2,200,000 | $2,200,000 | 100% | 61 |
| 176 Fairview Ave | Colonial | 1,237 | 3 | 1/1 | $525,000 | $525,000 | $505,000 | 96% | 20 |
| 2196 N. Benson Rd | Cape Cod | 1,680 | 3 | 1/1 | $550,000 | $550,000 | $585,000 | 106% | 7 |
| 138 Woodridge Ave | Colonial | 2,260 | 4 | 2/1 | $725,000 | $725,000 | $745,000 | 103% | 68 |
| 229 Lakeside Dr | Colonial, Ranch | 2,952 | 4 | 4/0 | $949,000 | $949,000 | $935,000 | 99% | 24 |
| 265 Warner Hill Rd | Colonial | 4,646 | 4 | 3/1 | $1,849,000 | $1,849,000 | $1,849,000 | 100% | 24 |
| 823 Oldfield Rd | Cape Cod | 1,326 | 3 | 1/0 | $630,000 | $630,000 | $615,000 | 98% | 5 |
| 62 Morehouse Hwy | Cape Cod | 2,150 | 3 | 3/1 | $649,000 | $649,000 | $710,000 | 109% | 14 |
| 543 S. Pine Creek Rd | Cape Cod | 1,931 | 3 | 2/0 | $825,000 | $825,000 | $800,000 | 97% | 54 |
| 1415 Mill Hill Ter | Colonial | 2,501 | 4 | 2/1 | $925,000 | $925,000 | $1,080,000 | 117% | 7 |
| 3960 Redding Rd | Split Level | 2,712 | 3 | 2/1 | $1,195,000 | $1,195,000 | $1,200,000 | 100% | 19 |
| 1037 Fairfield Beach Rd | Colonial | 3,512 | 6 | 3/2 | $1,599,000 | $1,599,000 | $1,500,000 | 94% | 86 |
| 84 Merry Meet Cir | Colonial | 8,714 | 5 | 6/3 | $1,949,000 | $1,949,000 | $1,870,000 | 96% | 236 |
| 431 Wilson St | Cape Cod | 1,210 | 3 | 2/0 | $425,000 | $425,000 | $425,000 | 100% | 48 |
| 273 Osborne Hill Rd | Ranch | 3,254 | 4 | 3/0 | $549,000 | $549,000 | $600,000 | 109% | 56 |
| 46 Baldwin Ter | Split Level | 1,294 | 3 | 2/0 | $639,000 | $639,000 | $655,000 | 103% | 25 |
| 975 Holland Hill Rd | Colonial | 1,939 | 4 | 2/0 | $664,000 | $664,000 | $730,000 | 110% | 18 |
| 195 Lalley Blvd | Colonial | 4,600 | 5 | 4/1 | $2,399,000 | $2,399,000 | $2,500,000 | 104% | 23 |
| 847 Sasco Hill Rd | Colonial | 4,779 | 4 | 4/1 | $2,950,000 | $2,950,000 | $2,900,000 | 98% | 175 |
| Units Sold: 98 | $709,950 | $696,950 | $706,500 | 100% | 38 |
Are You Interested In A Real Estate Review?