Serving New Haven and Fairfield Counties | Contact: (203) 895-2783
Menu
Menu
Trumbull Market Report August 2021
Market Overview
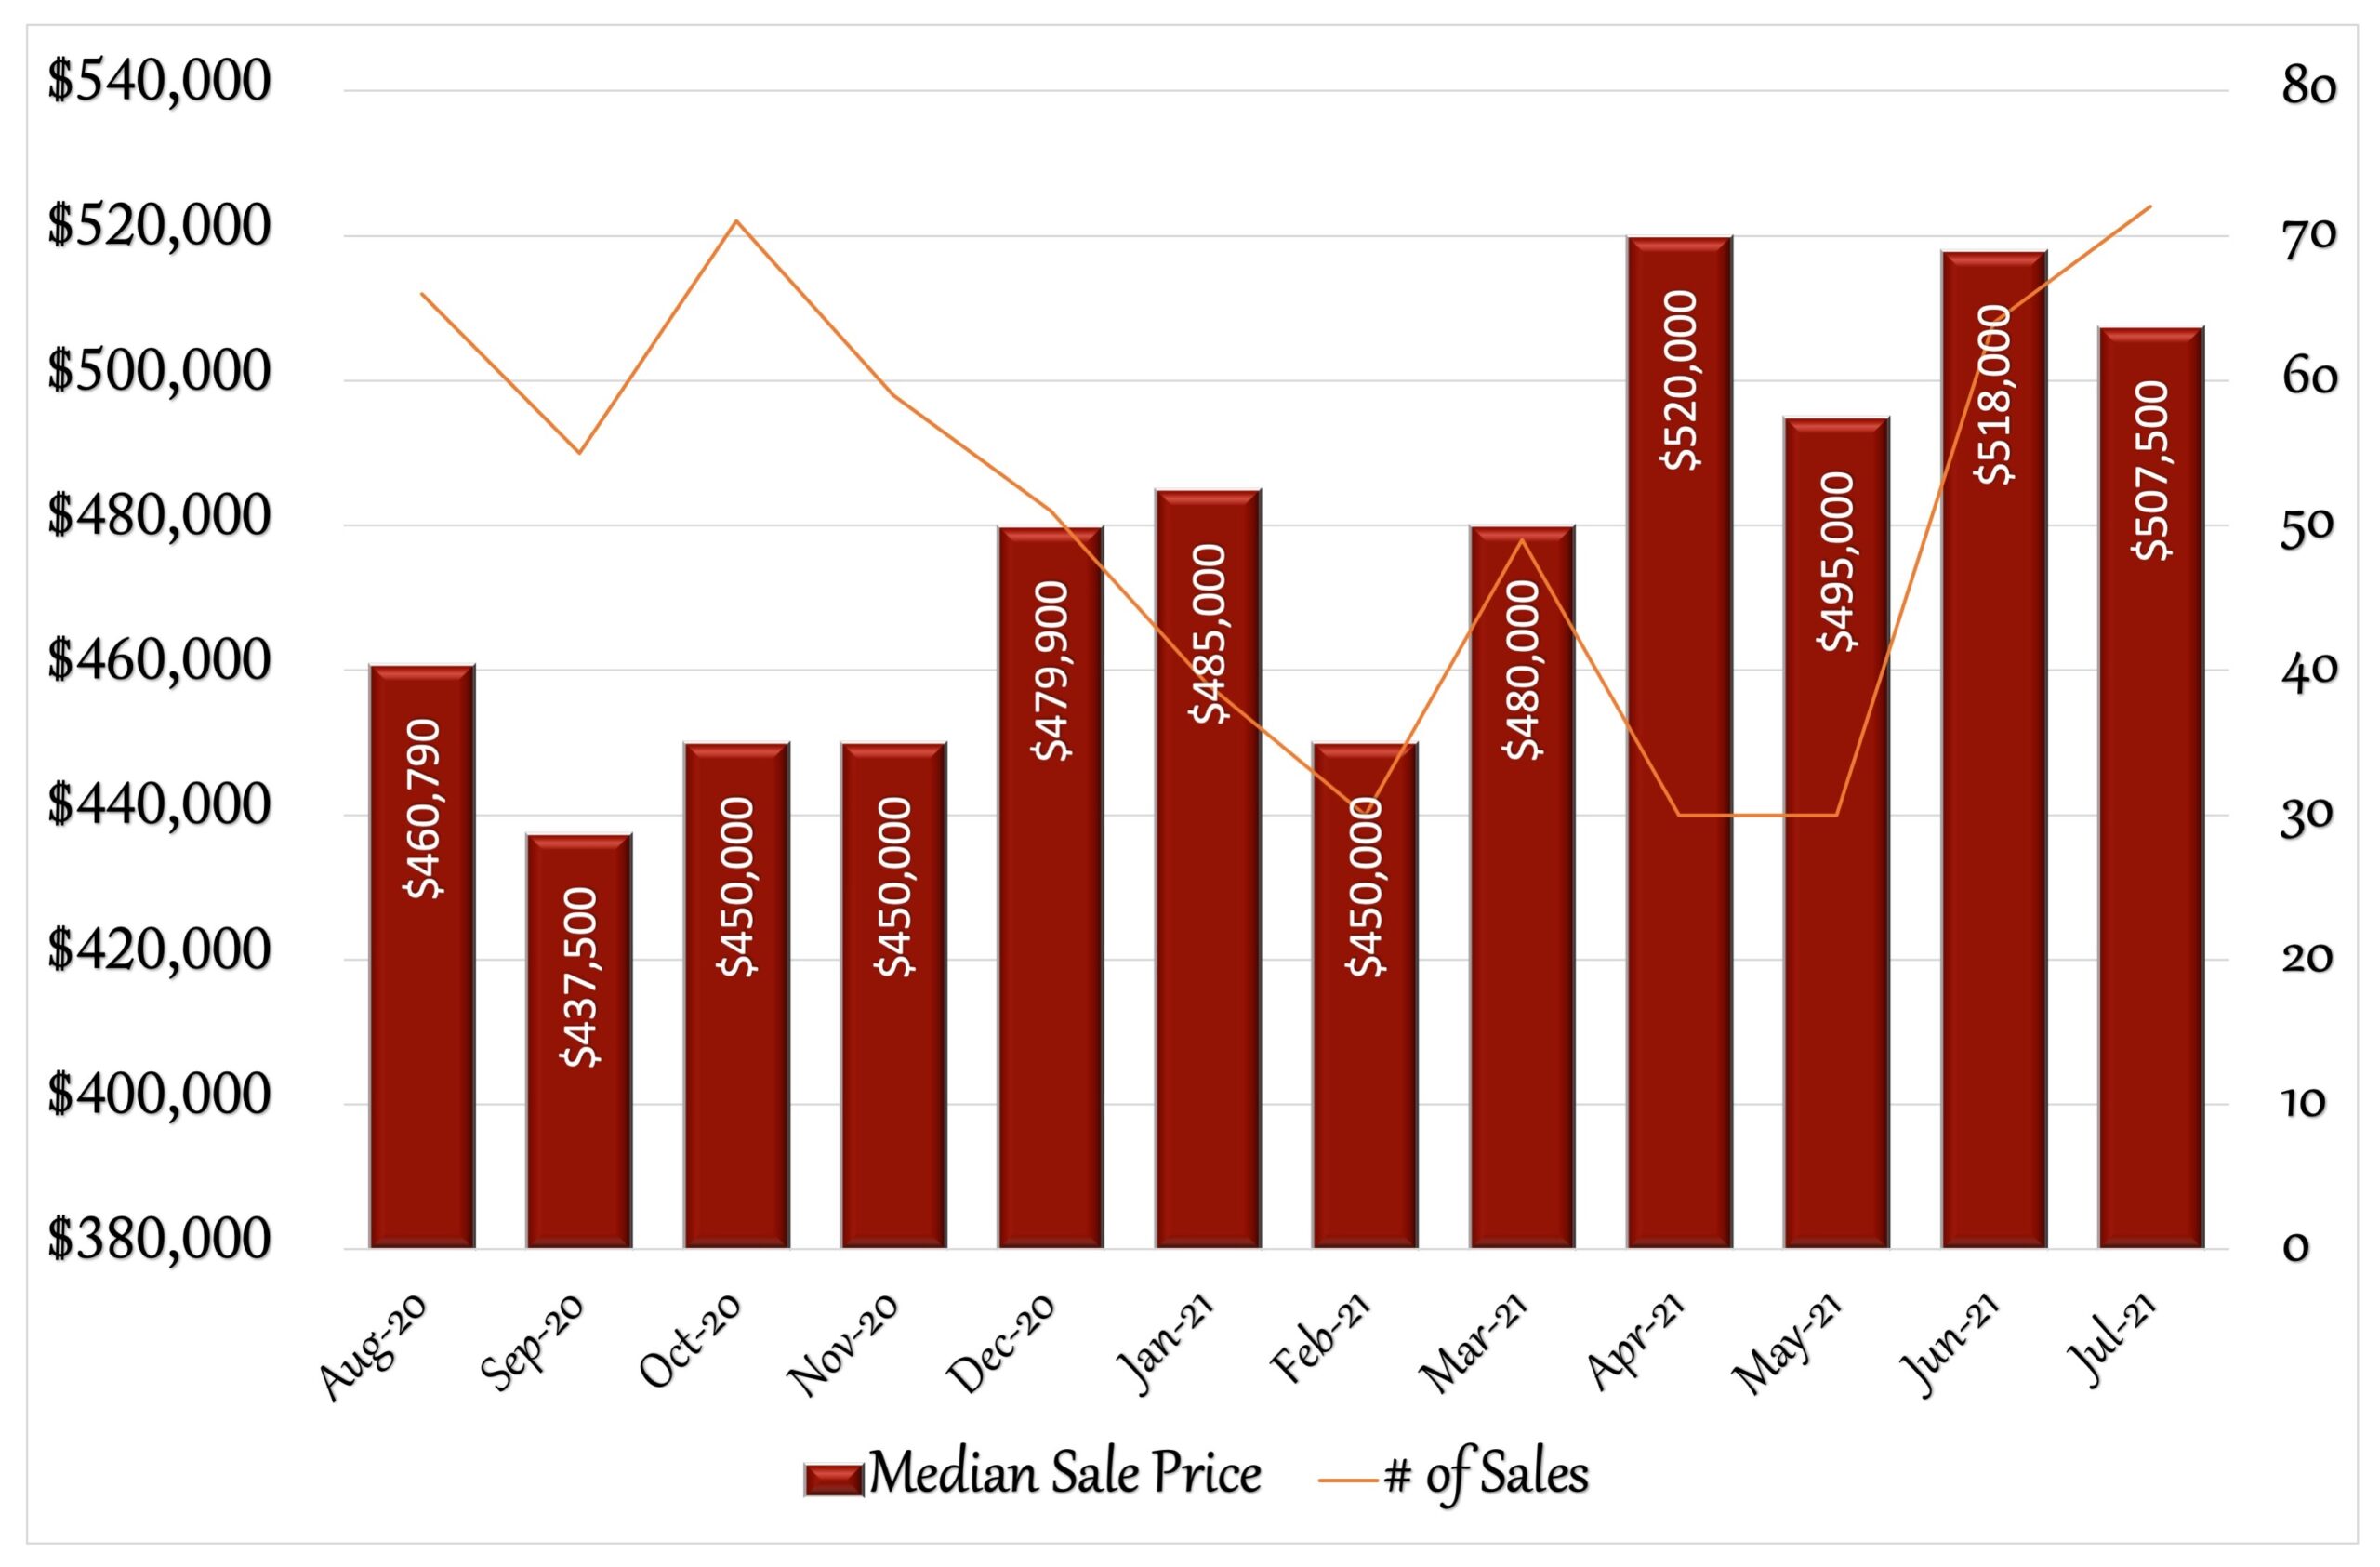
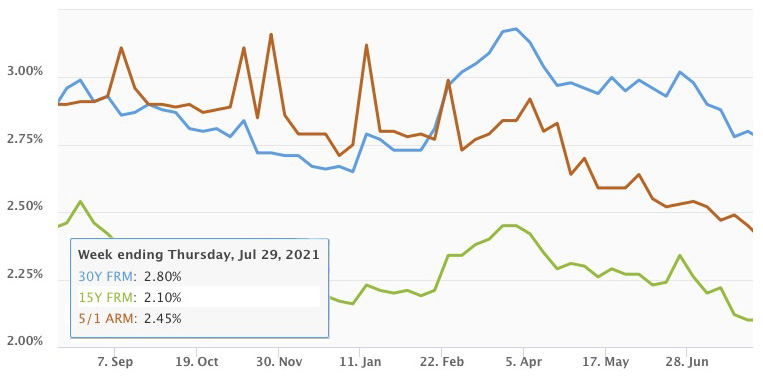
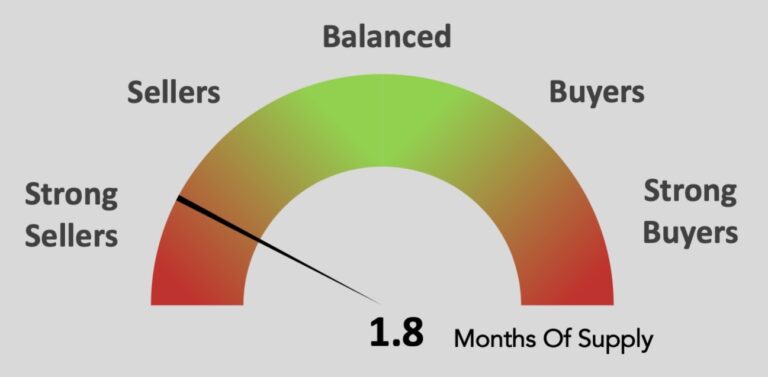
Trumbull has had a few up and down months when it comes to home values. The median sales price for a single family home was down about 2% in July, from $518,000 in June to $507,500 in July. Since January, home values are still up 4.64%. Sales were still strong, although not quite as good as June. The number of homes sold dropped from 96 to 86. The number of new houses to enter the market also dropped noticeably from 76 in June to 60 in July. Even with these downturns, the house that did sell, sold on average 7 days quicker. The days on market was a low 22 days. Sellers on average, also got somewhat more than their asking price. The percentage of list price to sold price was 103.1%. Sellers have been getting on average 100% or better for the past 11 out of 12 months. Even though the median sales price dropped, Trumbull continues to be in a strong sellers-market, with just 1.8 months of supply. Buyers are having trouble finding a home in Trumbull and need more inventory. Historically, July has been a slower month than June for Trumbull, with slight decreases in home values in 2019 and 2020. July 2018 saw a slight increase of 0.52% over June. Interest rates continue to be quite favorable for buyers, as the 30 year fixed rate was 2.8% by the end of July. That makes 4 straight months of sub 3% rates. While pending sales point to a slower month in August, favorable rates and strong buyer demand may help provide another solid month. For anyone considering a move, this is still a great time to sell a house in Trumbull. Do you know anyone looking for more information about their real estate market? I’d be happy to help.
12 Month Sales Activity
Housing Stats
(change from previous month)
| Median Sale Price: | $507,500 |
| change: | -2.03% |
| YTD change: | 4.64% |
| Units Sold: | 72 |
| change: | 12.50% |
| Active Listings: | 82 |
| change: | -7.69% |
| New Listings: | 60 |
| change: | -21.05% |
| Days on Market: | 22 |
| change: | -24.14% |
| Months of Supply: | 1.80 (Seller's Market) |
| change: | -5.26% |
Interest Rates
Market Temperature
Local Real Estate Price Trends
| Jun-21 | Jul-21 | Change | |
| Bethel | $515,000 | $500,000 | -2.91% |
| Bridgeport | $300,500 | $325,000 | 8.15% |
| Brookfield | $540,000 | $437,500 | -18.98% |
| Danbury | $447,500 | $400,000 | -10.61% |
| Easton | $889,450 | $682,000 | -23.32% |
| Fairfield | $765,000 | $706,500 | -7.65% |
| Milford | $432,500 | $404,500 | -6.47% |
| Monroe | $505,000 | $511,000 | 1.19% |
| Newtown | $572,500 | $500,000 | -12.66% |
| N. Haven | $342,500 | $438,500 | 28.03% |
| Orange | $461,500 | $500,000 | 8.34% |
| Oxford | $447,500 | $510,000 | 13.97% |
| Redding | $750,000 | $640,000 | -14.67% |
| Ridgefield | $757,500 | $875,000 | 15.51% |
| Seymour | $277,500 | $325,000 | 17.12% |
| Shelton | $419,900 | $442,500 | 5.38% |
| Stratford | $373,000 | $362,500 | -2.82% |
| Trumbull | $518,000 | $507,500 | -2.03% |
| Weston | $1,162,500 | $1,145,500 | -1.46% |
| Westport | $1,628,000 | $1,557,500 | -4.33% |
Tips
The Value of Using an Agent in Today’s Market
In an age where all the information we could possibly need is at our fingertips, many people have embraced a DIY lifestyle. But when it comes to real estate, it’s better to leave it to the pros. While saving commissions may seem appealing, you could end up losing time, money and bargaining power without a real estate agent’s expertise.
Why Do You Need a Real Estate Agent?
- An agent will devise a marketing plan specific to your home and will utilize their network to advertise your home to an audience you wouldn’t likely reach on your own.
- Agents are knowledgeable on the laws and regulations of the industry. Having an agent on your side can save you from legal troubles.
- Agents understand the market and can price your house to sell. They are also skilled negotiators that can get top dollar for your home.
Top 5 Home Improvements
Looking into home renovations? Here are the five improvements that will reward you the greatest ROI, according to RISMedia.com.
- As an eye-catching feature, garage door replacements boast the best ROI (94% of the cost) at resale time, especially with a strategic design that complements your home’s architectural style.
- Manufactured stone veneer is a high-reward, affordable siding material that can enhance both the curb appeal and interior design of your house.
- To maximize kitchen remodeling, opt for mid-range changes like refacing or replacing cabinets and countertops, updating fixtures and hardware, and/or replacing appliances.
- If stone veneer isn’t for you, try fiber cement siding for surfacing that looks like authentic wood but isn’t prone to warping and rotting.
- Window replacements will serve both your home’s aesthetic appeal as well as its energy efficiency.
Real Estate Headlines
Bidding War Winners Are Getting Cold Feet: Some home buyers are reportedly backing out of purchase contracts due to second-guessing the contract price, after winning a bidding war. The trend is most common in the Northeast and Mountain regions of the country. After losing out in several multiple offer situations, a buyer may head into a new bidding war with an “I’ll offer anything” attitude. After the jubilance of winning wears off, the reality of overpaying sets in. Many develop cold feet and back out of the contract, thus putting the now stigmatized house back on the market.
Sales of $1M-Plus Homes Soar: Unlike past housing booms, the real estate market is seeing a surge in sales at the very top of the housing market. More expensive properties are selling nearly twice as fast as lower and mid-priced homes. “Wealthier Americans have benefited greatly during the pandemic thanks to the rising stock market, which typically helps grow net wealth,” Lawrence Yun, chief economist at the National Association of REALTORS®, told The Washington Post. “So there’s greater demand for luxury housing now and that sector isn’t as hamstrung by inventory shortages as the rest of the market.”
MLS Finds That Listed Homes Sell for 17% More: In a two-year analysis, homes on a mid-Atlantic MLS sold for more money than similar homes that sold off of it. Bright MLS, a multiple listing service from Pennsylvania to Virginia, conducted the study of 442,829 records for home sales transactions completed between January 2019 and December 2020. The median sold on the MLS was about 17% higher than homes sold off of the MLS, through for sale by owner. The study found that the fastest sales for the most money use the MLS to market the homes for sale.
30-Year Mortgage Rate Dips to 2.77%: New fears over the fast-spreading COVID-19 delta variant are moving mortgage rates lower. The 30-year fixed-rate mortgage spent another week under 3%.
Delta Variant Could Cause Housing Volatility: The fast-spreading delta variant of the coronavirus is prompting more pandemic precautions to return. It’s also affecting the hot housing market and likely will continue to be housing’s wild card over the next few months, economists say. The fears of a more contagious version of the coronavirus could prompt some homeowners to delay selling their home, which would press on inventory levels just as they were starting to see some improvement. If buyer demand stays high and inventories fall again, that could then press on home prices even more and ignite more bidding wars for limited housing stock.
Upcoming Events
Connecticut’s event schedule is back this Summer, with outdoor concerts, plays, festivals, craft shows and more. So grab the family, hit the road and enjoy some of the area’s great fun filled events.
Sales Trends
July Single-Family Home Sales
(OLP: original list price • LP: list price • SP: sale price • DOM: days on market)
| Address | Style | sq ft | BR | BA (f/h) | OLP | LP | SP | SP/OLP | DOM |
| 62 Rolling Wood Dr | Split Level | 2,126 | 4 | 2/0 | $389,900 | $389,900 | $390,000 | 100% | 22 |
| 5758 Main St | Colonial | 2,014 | 2 | 1/1 | $374,900 | $374,900 | $408,000 | 109% | 12 |
| 32 Robinwood Rd | Cape Cod | 2,051 | 3 | 2/0 | $414,900 | $414,900 | $420,000 | 101% | 7 |
| 344 Booth Hill Rd | Colonial | 1,880 | 3 | 1/1 | $439,000 | $439,000 | $450,000 | 103% | 5 |
| 156 Teller Rd | Colonial | 2,898 | 4 | 2/1 | $429,900 | $429,900 | $461,000 | 107% | 72 |
| 51 Crocus Ln | Raised Ranch | 2,145 | 3 | 2/1 | $510,000 | $510,000 | $515,000 | 101% | 19 |
| 12 Pambar Rd | Raised Ranch | 2,500 | 3 | 2/1 | $499,900 | $499,900 | $515,000 | 103% | 21 |
| 20 Maple Ridge Rd | Colonial | 3,044 | 4 | 4/0 | $569,000 | $569,000 | $599,000 | 105% | 4 |
| 269 Booth Hill Rd | Ranch | 1,696 | 3 | 1/0 | $349,900 | $349,900 | $375,000 | 107% | 25 |
| 16 Ruth St | Cape Cod | 2,076 | 4 | 2/0 | $419,000 | $419,000 | $450,000 | 107% | 7 |
| 129 Middlebrooks Ave | Split Level | 2,374 | 3 | 1/1 | $463,000 | $463,000 | $472,000 | 102% | 2 |
| 44 Haverhill Rd | Raised Ranch | 1,582 | 3 | 2/1 | $529,000 | $509,000 | $490,000 | 93% | 26 |
| 100 Haverhill Rd | Colonial | 2,284 | 4 | 2/0 | $489,900 | $489,900 | $525,000 | 107% | 18 |
| 243 Pinewood Trl | Raised Ranch | 1,994 | 3 | 2/0 | $499,900 | $499,900 | $535,000 | 107% | 28 |
| 51 Koger Rd | Colonial | 2,136 | 3 | 2/1 | $489,000 | $489,000 | $480,000 | 98% | 83 |
| 126 Greenfield Dr | Cape Cod | 2,052 | 4 | 2/0 | $489,000 | $489,000 | $500,000 | 102% | 4 |
| 200 Edison Rd | Colonial | 2,714 | 3 | 2/1 | $589,900 | $589,900 | $572,000 | 97% | 89 |
| 111 Merrimac Dr | Ranch | 3,860 | 4 | 3/1 | $619,900 | $619,900 | $620,000 | 100% | 18 |
| 27 Crown St | Colonial | 2,563 | 4 | 4/0 | $499,900 | $499,900 | $520,000 | 104% | 15 |
| 11 Jade Tree Ln | Contemporary, Ranch | 2,750 | 4 | 2/1 | $699,900 | $649,900 | $660,000 | 94% | 90 |
| 12 Bailey St | Cape Cod | 1,888 | 3 | 1/1 | $389,000 | $389,000 | $400,000 | 103% | 30 |
| 31 Overlook Pl | Ranch | 2,000 | 3 | 2/0 | $439,900 | $439,900 | $425,000 | 97% | 41 |
| 1224 Daniels Farm Rd | Colonial | 4,057 | 4 | 4/0 | $875,000 | $875,000 | $894,000 | 102% | 54 |
| 247 Park Ln | Ranch | 1,344 | 3 | 1/0 | $299,900 | $299,900 | $315,000 | 105% | 2 |
| 26 Lincoln St | Raised Ranch | 1,862 | 3 | 2/0 | $379,900 | $374,900 | $400,500 | 105% | 22 |
| 386 Shelton Rd | Ranch | 1,500 | 3 | 2/0 | $449,000 | $449,000 | $475,000 | 106% | 1 |
| 227 Fernwood Rd | Ranch | 1,893 | 3 | 2/0 | $469,900 | $469,900 | $505,000 | 107% | 48 |
| 110 Moose Hill Rd | Colonial | 2,782 | 4 | 3/0 | $550,000 | $550,000 | $580,000 | 105% | 28 |
| 134 Crabapple Rd | Ranch | 2,748 | 4 | 2/1 | $699,900 | $699,900 | $721,000 | 103% | 43 |
| 86 Shelter Rock Rd | Colonial | 3,528 | 4 | 3/1 | $719,000 | $719,000 | $732,500 | 102% | 27 |
| 32 Edinburg Ln | Colonial | 6,073 | 5 | 4/1 | $1,099,900 | $1,049,900 | $1,000,000 | 91% | 52 |
| 38 Old Dairy Rd | Colonial | 4,761 | 5 | 4/1 | $1,595,000 | $1,395,000 | $1,395,000 | 87% | 50 |
| 1 Woodfield Dr | Raised Ranch | 1,684 | 3 | 2/0 | $439,900 | $439,900 | $440,000 | 100% | 4 |
| 76 Moose Hill Rd | Raised Ranch | 1,744 | 3 | 1/0 | $399,980 | $377,000 | $371,000 | 93% | 21 |
| 55 Round Hill Rd | Colonial, Contemporary | 2,338 | 4 | 3/1 | $499,900 | $482,500 | $477,000 | 95% | 75 |
| 66 North St | Raised Ranch | 2,432 | 4 | 2/1 | $479,900 | $485,000 | $485,000 | 101% | 29 |
| 26 Edgewood Ave | Cape Cod, Ranch | 2,445 | 3 | 2/0 | $525,000 | $525,000 | $515,000 | 98% | 31 |
| 27 Windy Rdg | Cape Cod | 2,566 | 5 | 2/0 | $489,000 | $489,000 | $530,000 | 108% | 20 |
| 17 Indian Ledge Dr | Colonial | 3,546 | 3 | 2/1 | $600,000 | $600,000 | $630,000 | 105% | 13 |
| 92 Meadow Rd W. | Colonial | 3,870 | 4 | 3/1 | $789,900 | $789,900 | $830,000 | 105% | 7 |
| 12 Roseview Ct | Colonial | 5,875 | 4 | 3/1 | $860,000 | $860,000 | $905,000 | 105% | 33 |
| 142 Richfield Rd | Ranch | 1,969 | 3 | 2/1 | $444,900 | $444,900 | $470,000 | 106% | 42 |
| 68 Arden Rd | Ranch | 1,856 | 3 | 1/1 | $465,000 | $465,000 | $500,000 | 108% | 7 |
| 44 Shelter Rock Rd | Colonial | 2,762 | 4 | 3/1 | $560,000 | $560,000 | $578,000 | 103% | 22 |
| 54 Old Sawmill Rd | Contemporary | 2,594 | 3 | 3/0 | $649,000 | $649,000 | $605,000 | 93% | 62 |
| 8 Elaine St | Ranch | 1,138 | 2 | 1/0 | $300,000 | $300,000 | $325,000 | 108% | 55 |
| 60 Lillian Dr | Cape Cod | 3,822 | 4 | 4/0 | $295,000 | $295,000 | $327,500 | 111% | 16 |
| 132 Teller Rd | Ranch | 1,689 | 4 | 3/0 | $479,900 | $479,900 | $500,000 | 104% | 17 |
| 54 Frost Hill Rd | Colonial | 3,951 | 5 | 3/1 | $649,900 | $649,900 | $650,000 | 100% | 64 |
| 23 Clark Rd | Split Level | 1,941 | 4 | 3/0 | $479,000 | $479,000 | $558,000 | 116% | 14 |
| 30 Red Barn Rd | Colonial | 2,788 | 4 | 2/1 | $665,000 | $665,000 | $700,000 | 105% | 2 |
| 16 Fawn Meadow Dr | Raised Ranch | 4,076 | 4 | 3/1 | $724,900 | $724,900 | $700,000 | 97% | 5 |
| 204 Tashua Rd | Ranch | 1,844 | 3 | 2/0 | $325,000 | $325,000 | $360,000 | 111% | 21 |
| 79 Stonehouse Rd | Ranch | 1,739 | 3 | 2/1 | $349,000 | $349,000 | $364,500 | 104% | 58 |
| 37 Beardsley Pkwy | Colonial | 1,982 | 3 | 1/0 | $339,000 | $339,000 | $410,000 | 121% | 21 |
| 214 Edison Rd | Colonial | 2,232 | 3 | 2/1 | $525,000 | $525,000 | $585,000 | 111% | 11 |
| 248 Pinewood Trl | Colonial, Contemporary | 3,745 | 4 | 3/2 | $1,300,000 | $1,300,000 | $1,400,500 | 108% | 5 |
| 28 Teeter Rock Rd | Colonial | 2,410 | 4 | 2/1 | $599,900 | $599,900 | $675,000 | 113% | 54 |
| 22 Midland Rd | Raised Ranch | 3,926 | 4 | 3/2 | $665,000 | $665,000 | $728,000 | 109% | 5 |
| 114 Bassick Rd | Hi-Ranch | 1,283 | 3 | 1/1 | $339,900 | $339,900 | $350,000 | 103% | 5 |
| 11 Morris Ave | Cape Cod | 1,724 | 3 | 2/0 | $429,900 | $409,900 | $385,000 | 90% | 16 |
| 50 Lakewood Dr | Ranch | 1,531 | 3 | 1/1 | $399,000 | $399,000 | $420,000 | 105% | 3 |
| 12 Briarcroft Ave | Colonial | 2,493 | 4 | 2/1 | $510,000 | $510,000 | $495,000 | 97% | 64 |
| 129 Merrimac Dr | Ranch | 3,080 | 4 | 3/1 | $539,900 | $529,900 | $525,000 | 97% | 36 |
| 73 Salem Rd | Colonial | 3,034 | 4 | 3/1 | $675,000 | $649,000 | $650,000 | 96% | 10 |
| 21 October Ln | Colonial | 4,100 | 5 | 4/1 | $799,900 | $799,900 | $765,000 | 96% | 119 |
| 670 Booth Hill Rd | Raised Ranch | 2,450 | 3 | 2/1 | $370,000 | $370,000 | $340,000 | 92% | 44 |
| 61 Leffert Rd | Ranch | 1,782 | 4 | 1/1 | $449,000 | $449,000 | $480,000 | 107% | 14 |
| 40 Shawnee Rd | Contemporary, Split Level | 1,740 | 3 | 1/1 | $459,000 | $459,000 | $485,000 | 106% | 35 |
| 4 Bailey St | Colonial | 2,887 | 5 | 3/0 | $489,900 | $489,900 | $510,000 | 104% | 45 |
| 7 McGuire Rd | Colonial | 2,938 | 4 | 3/0 | $525,000 | $525,000 | $525,000 | 100% | 38 |
| 198 Tanglewood Rd | Colonial, Contemporary | 3,423 | 4 | 4/0 | $800,000 | $800,000 | $800,000 | 100% | 12 |
| Units Sold: 72 | $489,900 | $489,450 | $507,500 | 103% | 22 |
Are You Interested In A Real Estate Review?