
Serving New Haven and Fairfield Counties | Contact: (203) 895-2783
Menu
Menu
Fairfield Market Report July 2022
Market Overview
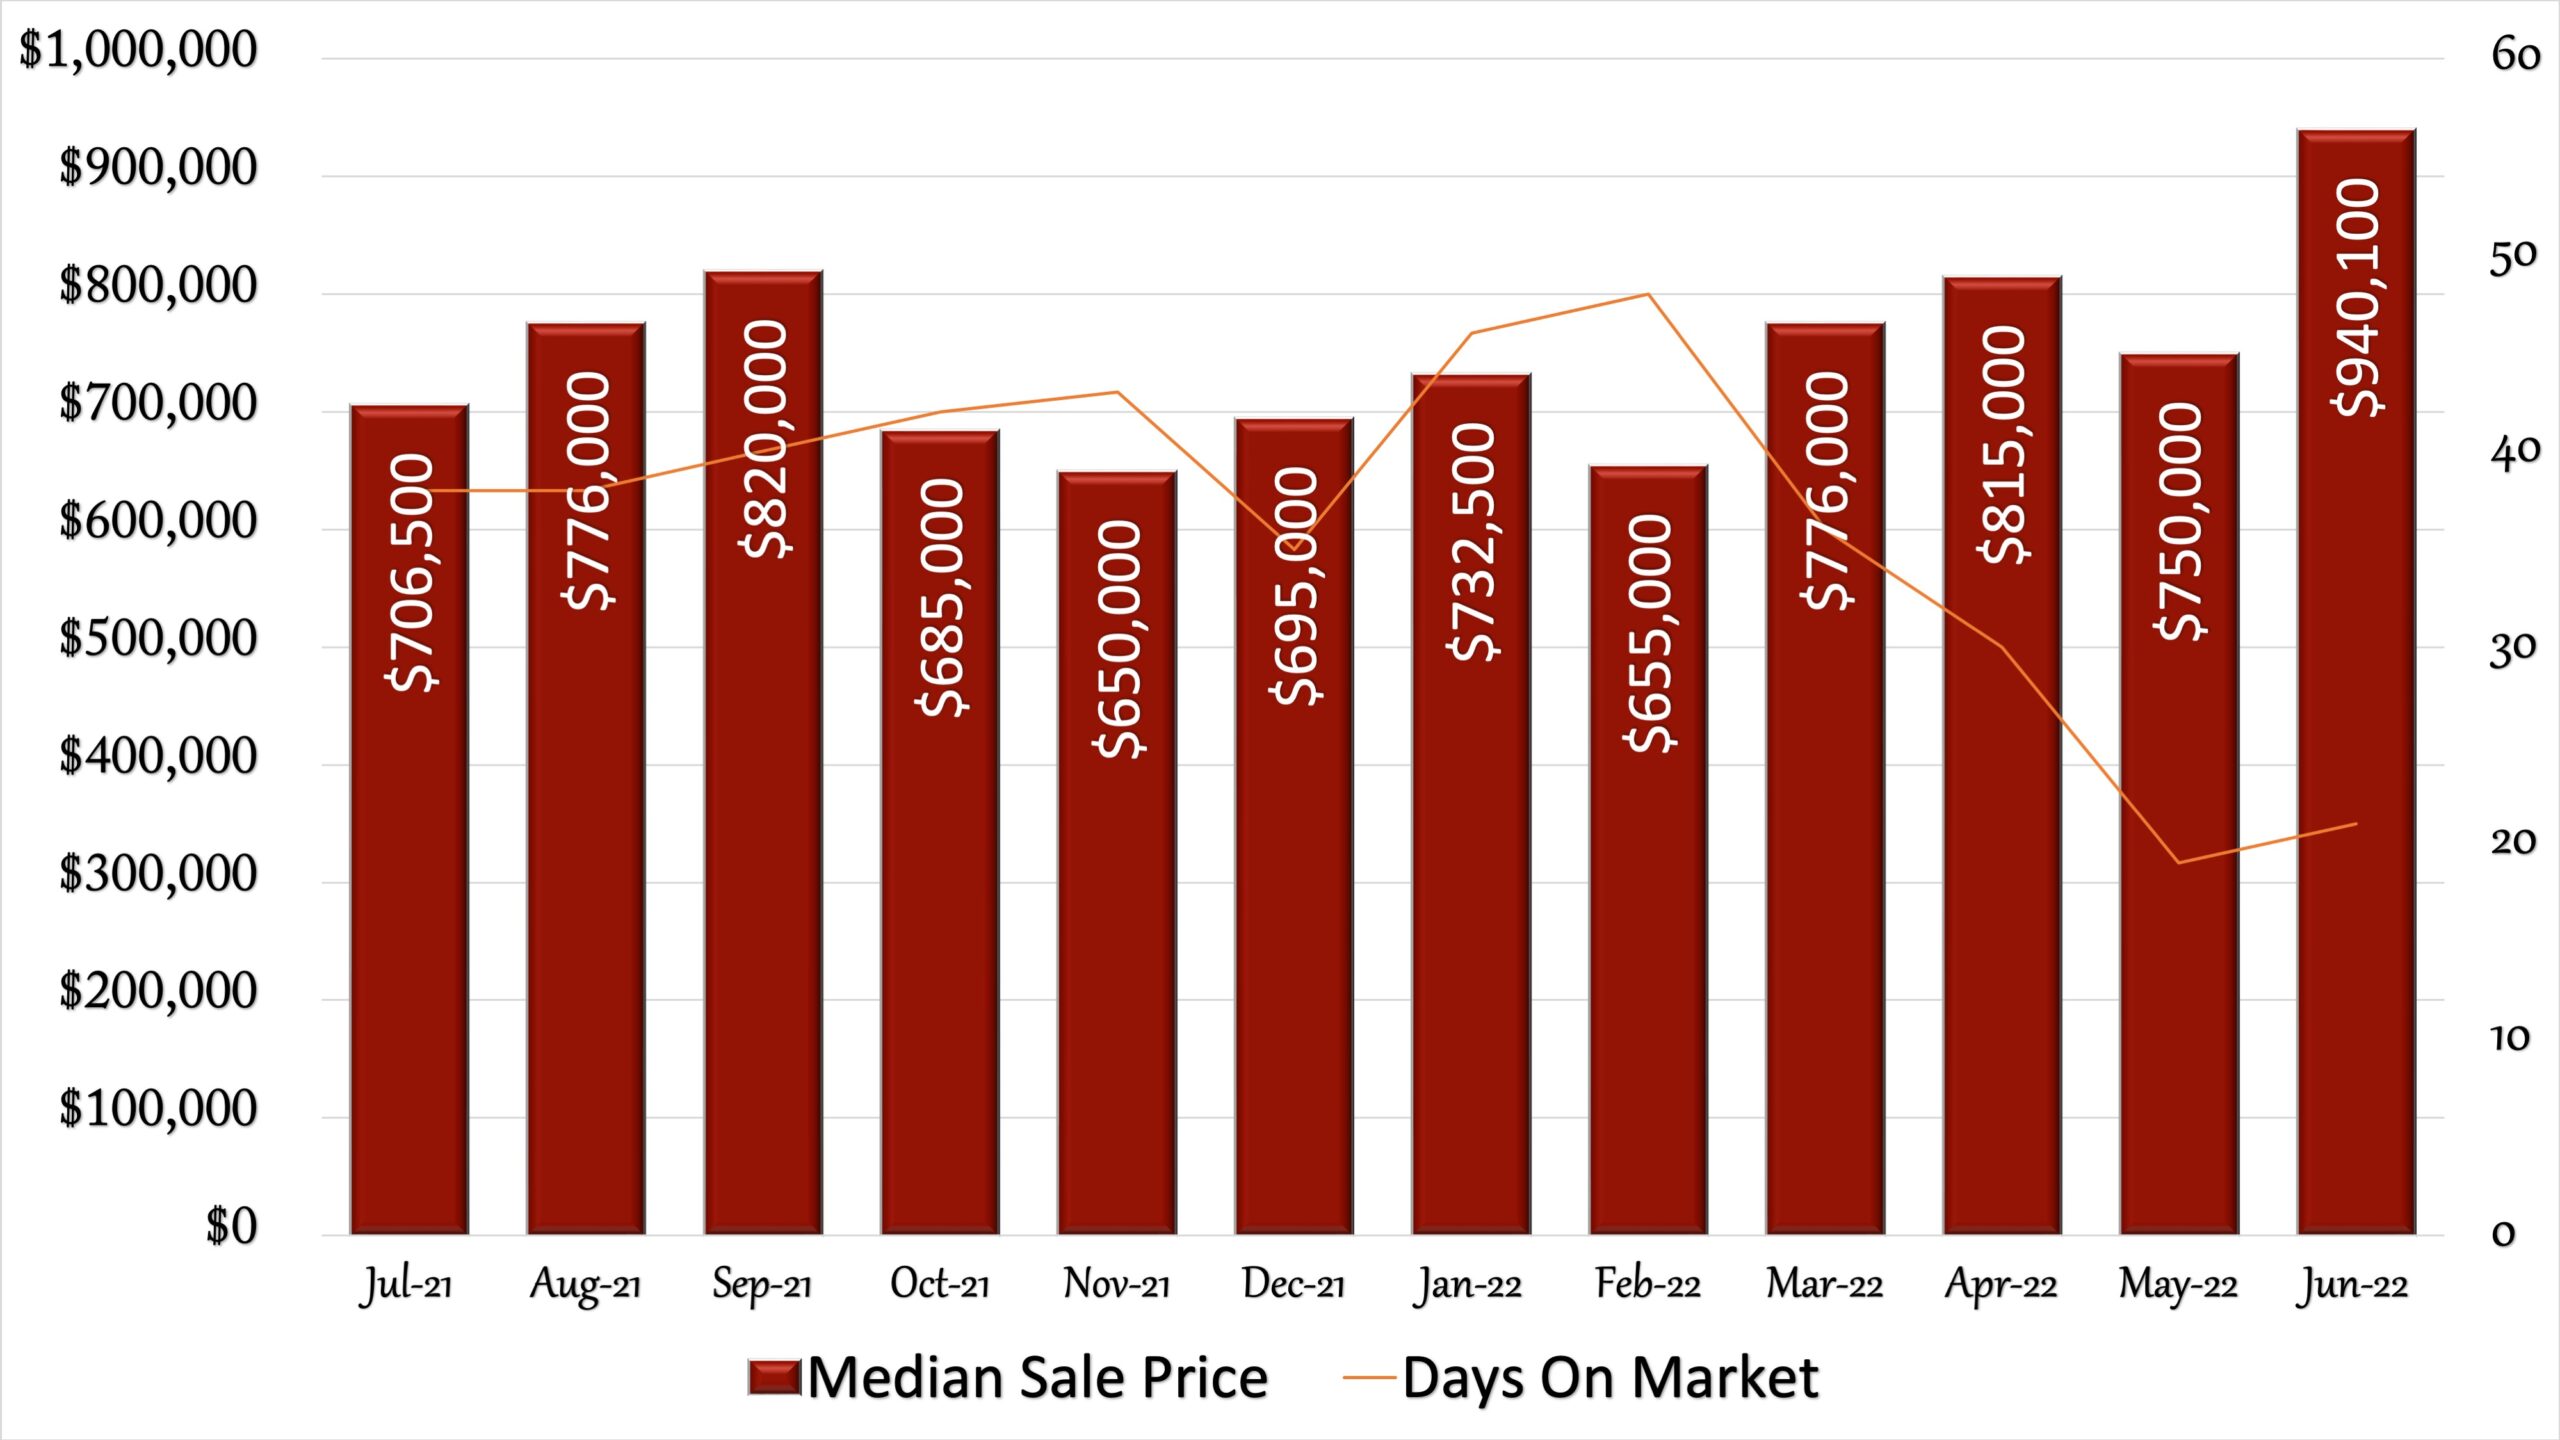
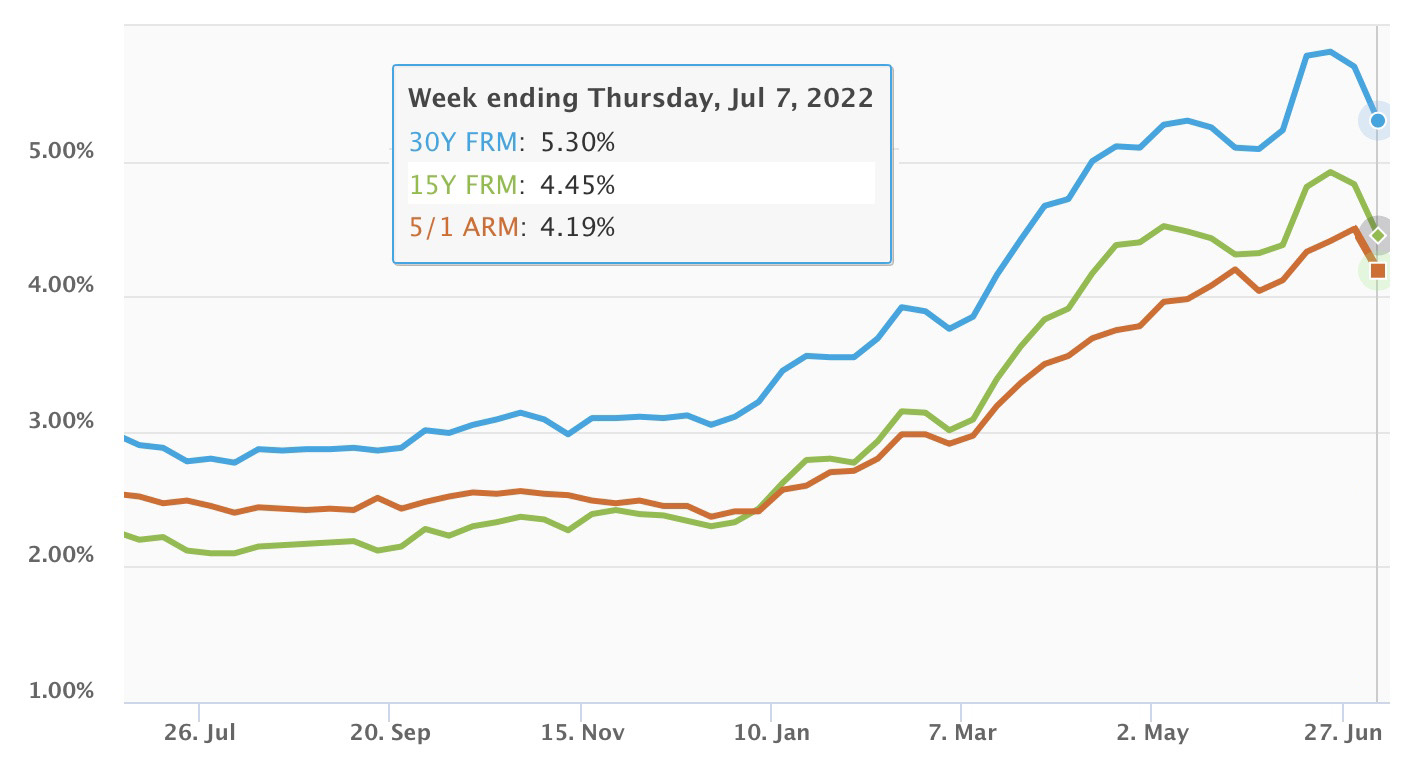
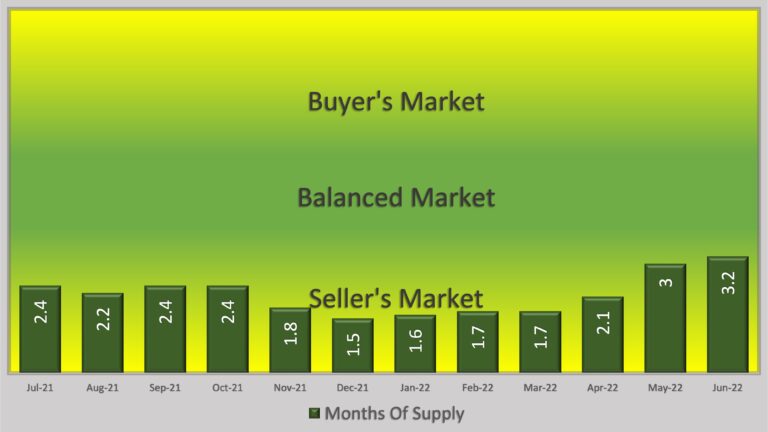
Fairfield property values experienced an impressive 25% one month increase from May’s values. That extends a 7 month increase in the median sales price for a single family home (save February and May, which experienced decreases from their previous months). That’s makes a 44% increase from November’s 12 month low of $650,000 to June’s high of $940,100. June’s property values have exceeded the pre-great recession peak ($800,000) witnessed in September 2007 by over 17%. Only two other months have peeked above that $800,000 price (9/21 & 4/22). The question now is will property values continue to rise or level off. June also saw a sharp increase in interest rates as the Fed continued to raise the key short term rate in a multi-month effort to reign in record high inflation felt throughout the nation. The 30 year fixed mortgage rate started the month at 5.09%, peaked at 5.81% by week three and ended the month at 5.70%. By the end of the first week of July, rates had come down again to 5.3%. A rocky month for sure. High interest rates along with high property values have been putting pressure on buyers to find affordable homes. However, the market remains strong, as houses are still selling quickly. The time it took for homes to sell, although rising slightly, was still extremely low. June’s days on market was 21 compared to 19 in May. 21 days hasn’t been seen since May 2018. Another factor still favoring sellers has been the months of supply (the time it would take all the current inventory of homes to sell if no new homes come on the market). This number has been slowly increasing for the past several months, but at 3.2 months, this still points to a sellers-market. A stable market between buyers and sellers would be between 4-6 months. An increase over past months in the number new listings in June (113) and the number of active listings (207) is what’s driving the months of supply slightly higher. More sellers have been motivated to list in order to take advantage of record high property values and a pool of interested buyers eager to find a home before they are priced out. July also looks good as June’s pending sales rose from 63 to 84. For anyone considering a move, this is a great time to sell a house in Fairfield. Do you know anyone looking for more information about their real estate market? I’d be happy to help.
12 Month Sales Activity
Housing Stats
(change from previous month)
| Current Month | Previous Month | 12 month ago | |
| Median Sale Price: | $940,100 | $750,000 | $765,000 |
| change: | 25.35% | 22.89% | |
| YTD change: | 28.34% | ||
| Units Sold: | 83 | 57 | 106 |
| change: | 45.61% | -21.70% | |
| Active Listings: | 207 | 197 | 227 |
| change: | 5.08% | -8.81% | |
| New Listings: | 113 | 138 | 109 |
| change: | -18.12% | 3.67% | |
| Days on Market: | 21 | 19 | 29 |
| change: | 10.53% | -27.59% | |
| Months of Supply: | 3.2 | 3.0 | 2.4 |
| change: | 6.67% | 33.33% |
Interest Rates
Absorption Rate
Local Real Estate Price Trends
| Curent Month | Previous Month | Change | |
| Bethel | $500,000 | $565,000 | -11.50% |
| Bridgeport | $330,000 | $309,500 | 6.62% |
| Brookfield | $710,000 | $607,500 | 16.87% |
| Danbury | $440,000 | $411,000 | 7.06% |
| Easton | $962,000 | $933,300 | 3.08% |
| Fairfield | $940,100 | $750,000 | 25.35% |
| Milford | $450,000 | $425,000 | 5.88% |
| Monroe | $610,000 | $492,500 | 23.86% |
| Newtown | $675,000 | $642,500 | 5.06% |
| North Haven | $410,500 | $440,000 | -6.70% |
| Orange | $545,000 | $510,450 | 6.77% |
| Oxford | $490,000 | $457,853 | 7.02% |
| Redding | $968,100 | $680,800 | 42.20% |
| Ridgefield | $926,000 | $917,500 | 0.93% |
| Seymour | $307,600 | $340,000 | -9.53% |
| Shelton | $479,708 | $497,500 | -3.58% |
| Stratford | $415,000 | $395,000 | 5.06% |
| Trumbull | $570,000 | $620,000 | -8.06% |
| Weston | $1,487,500 | $1,190,000 | 25.00% |
| Westport | $2,076,500 | $2,097,500 | 1.01% |
National Real Estate Headlines
Sellers Rush Before Market Slows: Home sellers are growing concerned that they could miss out on the buyer frenzy. Signs of a slowing real estate market are growing across the country—existing-home sales and new-home sales are falling as well as pending home sales. The inventory of homes for sale rose 9% last week compared to a year ago, according to realtor.com®. New listings are rising nearly twice as fast in the past four weeks as they did a year ago. “Rising mortgage rates have caused the housing market to shift, and now home sellers are in a hurry to find a buyer before demand weakens further.
Home Buying Is 5% Cheaper Than a Week Ago: Mortgage rates are falling-at least for now-after posting rapid jumps in June. Over the last two weeks, the 30-year fixed-rate mortgage has dropped by one-half of a percentage point. Home buying is about 5% more affordable than a week ago, translating to about $100 less in monthly mortgage payments. Rates are dropping as concerns mount over a possible economic recession, says Sam Khater, Freddie Mac’s chief economist. “While the drop provides minor relief to buyers, the housing market will continue to normalize if home price growth materially slows due to the combination of low housing affordability and an expected economic slowdown,” Khater says. The 30-year fixed-rate averaged 5.30%, dropping from last week’s 5.70% average. Last year at this time, 30-year rates averaged 2.90%.
Majority of Aging Adults Say They’re Not Moving: Baby boomers hold the majority of real estate wealth in the U.S.—and as they age, they increasingly say they plan to stay put in their current homes. Sixty-six percent of U.S. adults aged 55 and older say they expect to age in place, according to a new Freddie Mac survey. But that could further exacerbate the housing supply shortage, the report notes. Baby boomers’ financial gains over the past five years may better equip them to stay in place, however, they acknowledge that their home will require some degree of renovations to make the space more appropriate to age in place. Smart technology is also making the choice easier. According to a study by insurance company The Hartford and the MIT AgeLab, these 10 technologies are making it easier for older Americans to handle home maintenance and safety concerns: Smart smoke and carbon monoxide detectors, Wireless doorbell cameras, Keyless entry, Automated lighting, Smart water shutoff valves, Smart home security systems, Smart outlets and plugs, Smart thermostats, Water and mold monitoring sensors, Smart window blinds.
New-Home Costs Rising at Unparalleled Rate: Inflation is pushing up homebuilding costs at an unprecedented rate, according to Bank of America’s Who Builds the House? report. Supply-chain disruptions and labor shortages are adding pressure to rising prices. The average cost for materials to build a single-family home jumped 42% from 2018 to 2021, according to the report. The median sales price of a new home in April reached a record $450,600, a 20% hike from a year earlier, Commerce Department data shows. Only about 10% of new homes in April on the market were priced at less than $300,000, according to the National Association of Home Builders. A year prior, that share was 25%.
Most Popular Garden Trends for 2022: Love them or hate them, gnomes are the biggest garden trend of 2022, according to a new study from Atlas Ceramics. They analyzed annual Google searches, Instagram posts, and TikTok data to identify the hottest garden trends of the summer. Their top 5 garden trends of 2022 are: garden gnomes, urban gardening, pergolas, bird baths and outdoor rugs & outdoor tiles.
Tips
Ecotourism on a Budget
A whopping 83% of global tourists say greener travel is imperative, according to Booking.com. So, it stands to reason that ecotourism is a growing market, expected to reach $385 billion by 2028.
The International Ecotourism Society has defined the movement as responsible travel “that conserves the environment, sustains the well-being of the local people and involves interpretation and education.”
Ecotourism doesn’t have to be luxurious, distant or expensive. In fact, the location only has to check three boxes: (1) Respects local cultures. (2) Minimizes environmental and social impacts on communities. (3) Recognizes the rights and spiritual beliefs of Indigenous Peoples.
If Costa Rica or Iceland are out of your reach, consider the endless ecotourism opportunities in the U.S., such as cycling trips, farm stays, National Park experiences, and even glamping. But do your homework first to help sort out the genuinely green options from the rest. Here are several questions to ask as you do your research.
- Are accommodations energy-efficient?
- Do the airlines use renewable biofuel?
- Is your tour operator committed to sustainability?
- Consider home-sharing because many sites are online. But beware of those who own numerous properties, as they can cut into the local housing pool.
- Rethink hostels: They’re less expensive than hotels, and many offer private rooms and complimentary breakfast.
- Commit to volunteering in a developing country, but do your due diligence when vetting opportunities.
Whether you choose to stay close to home or hop continents, it’s easier than ever to enjoy the world in sustainable and culturally meaningful ways without breaking the bank.
Recipe
Cucumber Watermelon Gazpacho
Ingredients
1 (3 lb.) seedless watermelon, diced (about 5 cups), divided
1 small cucumber, peeled, seeded, diced
1 medium red bell pepper, seeded, diced
1 medium yellow bell pepper, seeded, diced
1 small jalapeno pepper, seeded, minced
3 inner celery ribs, diced
½ small red onion, diced
¼ cup mint, chopped
3 Tbsp. lime juice
2 Tbsp. red wine vinegar
¼ tsp. salt
Fresh mint for garnish1 (3 lb.) seedless watermelon, diced (about 5 cups), divided
Fresh mint for garnish
Directions
Puree 4 cups diced watermelon in blender until smooth. Pour puree into a large bowl. Add remaining 1 cup diced watermelon and rest of the ingredients. Stir to combine.
Cover gazpacho and refrigerate until cold, at least 1 hour. Ladle gazpacho into bowls and garnish with mint and a watermelon slice.
Serves 4

Upcoming Events
A new year, all new events. Check out what’s going on throughout Connecticut.
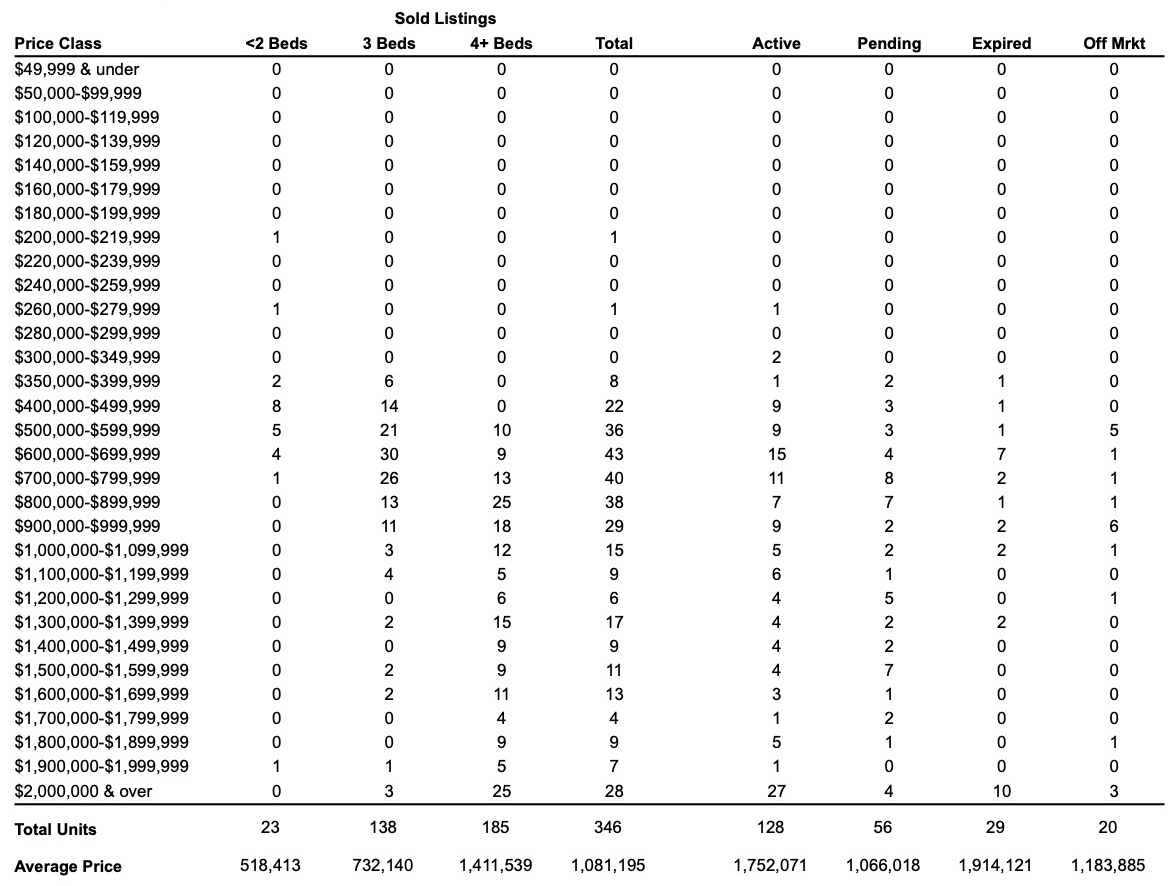
Sales Trends: January - June
June Single-Family Home Sales
(OLP: original list price • LP: list price • SP: sale price • DOM: days on market)
| Address | Style | sq ft | BR | BA (f/h) | OLP | LP | SP | SP/OLP | DOM |
| 119 Westford Dr | Cape Cod | 1,315 | 4 | 1/1 | $499,000 | $499,000 | $510,000 | 102% | 19 |
| 59 Emmy Ln | Ranch | 1,785 | 3 | 1/1 | $589,000 | $589,000 | $584,000 | 99% | 45 |
| 321 Judd St | Colonial | 2,045 | 3 | 2/1 | $620,000 | $620,000 | $620,000 | 100% | 8 |
| 117 South St | Colonial | 2,217 | 3 | 2/0 | $695,000 | $695,000 | $815,000 | 117% | 10 |
| 111 Toll House Ln | Ranch | 2,885 | 3 | 3/0 | $799,000 | $820,000 | $863,700 | 108% | 39 |
| 123 Pease Ave | Cape Cod | 2,100 | 4 | 3/0 | $850,000 | $850,000 | $900,000 | 106% | 3 |
| 57 Flower House Dr | Ranch | 3,136 | 3 | 2/1 | $890,000 | $890,000 | $940,100 | 106% | 17 |
| 192 Lindamir Ln | Colonial | 3,324 | 4 | 2/1 | $925,000 | $925,000 | $950,000 | 103% | 53 |
| 141 Acorn Ln | Colonial | 7,654 | 5 | 6/1 | $2,295,000 | $2,295,000 | $2,426,000 | 106% | 48 |
| 295 Hill Farm Rd | Colonial, Georgian Colonial | 6,086 | 5 | 5/1 | $1,399,000 | $1,399,000 | $1,350,000 | 96% | 35 |
| 1097 Fairfield Beach Rd | Colonial, Cottage | 1,940 | 4 | 2/1 | $2,900,000 | $2,900,000 | $2,300,000 | 79% | 30 |
| 168 Hillcrest Rd | Colonial | 1,411 | 3 | 1/1 | $430,000 | $430,000 | $450,000 | 105% | 16 |
| 103 Marian Rd | Ranch | 2,274 | 3 | 1/1 | $549,000 | $549,000 | $620,000 | 113% | 22 |
| 309 Round Hill Rd | Cape Cod | 1,508 | 3 | 2/0 | $595,000 | $595,000 | $665,000 | 112% | 11 |
| 37 Blueberry Ln | Cape Cod | 2,450 | 4 | 3/0 | $795,000 | $795,000 | $875,000 | 110% | 5 |
| 54 Hamilton Ct, Unit #54 | Colonial | 3,510 | 3 | 2/1 | $850,000 | $850,000 | $930,000 | 109% | 17 |
| 653 Tunxis Hill Rd | Cape Cod, Colonial | 1,098 | 3 | 2/0 | $375,000 | $375,000 | $355,000 | 95% | 6 |
| 55 Brion Dr | Raised Ranch | 1,582 | 3 | 3/0 | $589,900 | $589,900 | $590,000 | 100% | 5 |
| 604 Stratfield Rd | Farm House, Victorian | 3,092 | 3 | 4/0 | $789,000 | $789,000 | $889,000 | 113% | 15 |
| 243 Parkwood Rd | Cape Cod | 1,786 | 3 | 2/0 | $799,000 | $799,000 | $901,000 | 113% | 37 |
| 105 Burr St | Colonial, Contemporary | 4,061 | 3 | 3/1 | $1,195,000 | $1,195,000 | $1,335,000 | 112% | 13 |
| 174 Stonybrook Rd | Colonial | 3,693 | 3 | 3/1 | $1,250,000 | $1,250,000 | $1,450,000 | 116% | 15 |
| 151 Aran Hill Rd | Colonial | 5,050 | 5 | 3/2 | $1,799,000 | $1,799,000 | $1,700,000 | 94% | 26 |
| 301 Knapps Hwy | Cape Cod | 1,315 | 3 | 1/0 | $399,000 | $399,000 | $455,000 | 114% | 42 |
| 40 Harvester Rd | Cape Cod | 1,644 | 3 | 2/0 | $549,000 | $524,900 | $522,500 | 95% | 51 |
| 3000 Black Rock Tpke | Cape Cod | 1,450 | 3 | 2/0 | $539,900 | $539,900 | $605,000 | 112% | 4 |
| 551 Joan Dr | Ranch | 2,780 | 3 | 2/1 | $924,900 | $924,900 | $930,000 | 101% | 21 |
| 135 Warner Hill Rd | Ranch, Split Level | 1,979 | 4 | 2/1 | $1,199,000 | $1,199,000 | $1,089,000 | 91% | 85 |
| 133 Longdean Rd | Contemporary, Bungalow | 3,000 | 4 | 3/1 | $1,399,000 | $1,399,000 | $1,527,000 | 109% | 12 |
| 26 Edward St | Colonial | 4,693 | 6 | 4/1 | $3,200,000 | $3,200,000 | $3,000,000 | 94% | 65 |
| 188 Margemere Dr | Colonial | 4,631 | 4 | 2/1 | $995,000 | $995,000 | $970,000 | 97% | 64 |
| 340 Merwins Ln | Cape Cod | 2,193 | 5 | 3/0 | $929,000 | $929,000 | $999,000 | 108% | 20 |
| 54 Figlar Ave | Colonial | 3,835 | 5 | 4/1 | $1,349,000 | $1,349,000 | $1,450,000 | 107% | 22 |
| 148 Puritan Rd | Colonial | 4,015 | 5 | 4/1 | $2,399,000 | $2,399,000 | $2,625,000 | 109% | 63 |
| 223 Doreen Dr | Ranch | 1,312 | 3 | 1/0 | $675,000 | $675,000 | $702,053 | 104% | 5 |
| 1491 Mill Hill Rd | Colonial | 2,259 | 4 | 2/1 | $1,249,000 | $1,249,000 | $1,425,000 | 114% | 24 |
| 92 Bibbins Ave | Cape Cod | 2,018 | 3 | 2/0 | $525,000 | $525,000 | $550,000 | 105% | 28 |
| 208 Wilson St | Colonial | 2,590 | 3 | 2/1 | $585,000 | $585,000 | $575,000 | 98% | 48 |
| 890 Church Hill Rd | Ranch, Modern | 1,920 | 4 | 3/0 | $750,000 | $750,000 | $737,500 | 98% | 44 |
| 49 Vesper St | Colonial | 2,867 | 4 | 3/0 | $839,900 | $839,900 | $820,000 | 98% | 41 |
| 45 Bennett St | Ranch | 1,636 | 2 | 2/0 | $400,000 | $400,000 | $420,000 | 105% | 70 |
| 125 Vesper St | Colonial | 1,896 | 3 | 2/2 | $589,000 | $569,000 | $565,000 | 96% | 29 |
| 903 Stillson Rd | Cape Cod | 1,985 | 4 | 2/0 | $599,999 | $599,999 | $625,000 | 104% | 40 |
| 487 Wormwood Rd | Colonial | 4,002 | 4 | 3/1 | $1,400,000 | $1,400,000 | $1,350,000 | 96% | 79 |
| 164 Woody Ln | Colonial | 3,172 | 4 | 3/1 | $825,000 | $825,000 | $1,037,000 | 126% | 38 |
| 381 Hoydens Hill Rd | Colonial | 2,912 | 4 | 3/0 | $998,000 | $998,000 | $1,040,000 | 104% | 11 |
| 197 Brookview Ave | Colonial | 2,279 | 5 | 3/1 | $679,000 | $679,000 | $777,000 | 114% | 13 |
| 975 Holland Hill Rd | Colonial | 1,939 | 4 | 2/0 | $799,000 | $799,000 | $835,000 | 105% | 23 |
| 10 Oxford Rd | Colonial | 1,994 | 3 | 2/0 | $849,000 | $849,000 | $860,000 | 101% | 9 |
| 1699 North St | Colonial | 5,316 | 5 | 3/1 | $1,249,000 | $1,249,000 | $1,310,000 | 105% | 35 |
| 483 Rowland Rd | Cape Cod, Colonial | 2,766 | 3 | 3/1 | $1,395,000 | $1,395,000 | $1,560,000 | 112% | 29 |
| 2661 Congress St | Colonial | 5,560 | 5 | 5/2 | $1,995,000 | $1,899,000 | $1,800,000 | 90% | 118 |
| 1227 Pequot Ave | Colonial | 7,738 | 9 | 8/1 | $9,450,000 | $9,450,000 | $8,812,500 | 93% | 43 |
| 1626 Stratfield Rd | Colonial | 1,343 | 3 | 1/0 | $476,700 | $460,000 | $441,000 | 93% | 62 |
| 370 Bronson Rd | Colonial | 2,268 | 4 | 2/1 | $1,095,000 | $1,095,000 | $1,205,000 | 110% | 8 |
| 209 Nichols St | Colonial | 1,480 | 3 | 1/1 | $899,900 | $899,900 | $1,026,000 | 114% | 9 |
| 10 Norwegian Woods | Cape Cod | 3,081 | 5 | 3/0 | $999,000 | $999,000 | $1,300,000 | 130% | 8 |
| 287 Homefair Dr | Colonial | 4,196 | 4 | 3/1 | $1,199,000 | $1,199,000 | $1,370,000 | 114% | 55 |
| 30 Laurel Brook Ln | Colonial | 8,416 | 6 | 8/1 | $1,995,000 | $1,995,000 | $2,225,000 | 112% | 7 |
| 277 Tuckahoe Ln | Split Level | 1,584 | 3 | 1/1 | $510,000 | $510,000 | $520,000 | 102% | 14 |
| 45 Vesper St | Colonial | 2,867 | 4 | 3/0 | $799,999 | $799,999 | $790,000 | 99% | 137 |
| 11 Orchard Hill Ln | Cape Cod | 2,123 | 3 | 2/0 | $789,000 | $789,000 | $925,000 | 117% | 24 |
| 865 Pequot Ave | Cottage | 1,716 | 2 | 1/0 | $2,000,000 | $2,000,000 | $1,900,000 | 95% | 43 |
| 1965 N. Benson Rd | Raised Ranch | 2,170 | 3 | 3/0 | $775,000 | $775,000 | $850,000 | 110% | 14 |
| 239 Stoneleigh Sq | Ranch | 4,040 | 4 | 3/1 | $899,000 | $899,000 | $915,000 | 102% | 29 |
| 240 Arbor Dr | Cape Cod, Colonial | 2,590 | 4 | 4/0 | $1,049,000 | $1,049,000 | $1,315,000 | 125% | 10 |
| 799 Hill Farm Rd | Georgian Colonial | 5,304 | 4 | 3/0 | $1,499,000 | $1,499,000 | $1,605,000 | 107% | 21 |
| 349 Beach Rd | Colonial | 5,140 | 5 | 4/1 | $2,495,000 | $2,495,000 | $2,450,000 | 98% | 11 |
| 112 Lalley Blvd | Colonial, Contemporary | 4,200 | 5 | 4/1 | $2,500,000 | $2,499,000 | $2,500,000 | 100% | 7 |
| 72 Rose Hill Rd | Colonial | 3,126 | 3 | 3/1 | $3,495,000 | $3,495,000 | $3,250,000 | 93% | 8 |
| 2063 Mill Plain Rd | Colonial | 2,852 | 4 | 3/0 | $869,000 | $849,000 | $834,000 | 96% | 31 |
| 761 Merwins Ln | Ranch | 2,538 | 4 | 3/0 | $965,000 | $965,000 | $1,256,000 | 130% | 19 |
| 145 Vesper St | Colonial | 1,440 | 3 | 2/0 | $535,000 | $535,000 | $540,000 | 101% | 40 |
| 33 Reef Ct | Cape Cod | 1,497 | 3 | 1/1 | $530,000 | $530,000 | $625,000 | 118% | 11 |
| 1133 Galloping Hill Rd | Colonial | 4,096 | 5 | 4/0 | $1,249,000 | $1,249,000 | $1,378,000 | 110% | 11 |
| 46 Milton St | Cape Cod | 1,669 | 3 | 2/0 | $825,000 | $825,000 | $865,000 | 105% | 24 |
| 41 Oakwood Dr | Cape Cod | 1,813 | 3 | 3/0 | $775,000 | $775,000 | $865,017 | 112% | 9 |
| 1420 Galloping Hill Rd | Colonial | 4,598 | 5 | 5/0 | $1,200,000 | $1,200,000 | $975,000 | 81% | 15 |
| 1080 S. Pine Creek Rd | Cape Cod, Colonial | 3,384 | 5 | 4/0 | $1,000,000 | $1,000,000 | $1,000,000 | 100% | 19 |
| 195 Eastlea Rd | Cape Cod, Colonial | 3,588 | 4 | 2/2 | $1,299,000 | $1,299,000 | $1,380,000 | 106% | 19 |
| 60 Brett Rd | Colonial | 3,765 | 5 | 4/1 | $1,285,000 | $1,285,000 | $1,550,000 | 121% | 11 |
| 401 Old Post Rd | Antique | 2,240 | 3 | 2/1 | $1,395,000 | $1,395,000 | $1,560,000 | 112% | 27 |
| 1135 Fairfield Beach Rd | Cottage | 1,744 | 3 | 2/0 | $1,925,000 | $1,925,000 | $1,925,000 | 100% | 10 |
| Units Sold: 83 | $899,000 | $899,000 | $940,100 | 105% | 21 |
Are You Interested In A Real Estate Review?
July 16th: guinea pig appreciation day | July 18th: global hug your kids day | July 22nd: national hammock day | July 24th: international self-care day | July 26th: national coffee milkshake day | July 28th: national chili dog day | July 31st: avocado day