Serving New Haven and Fairfield Counties | Contact: (203) 895-2783
Menu
Menu
Stratford Market Report November 2021
Market Overview
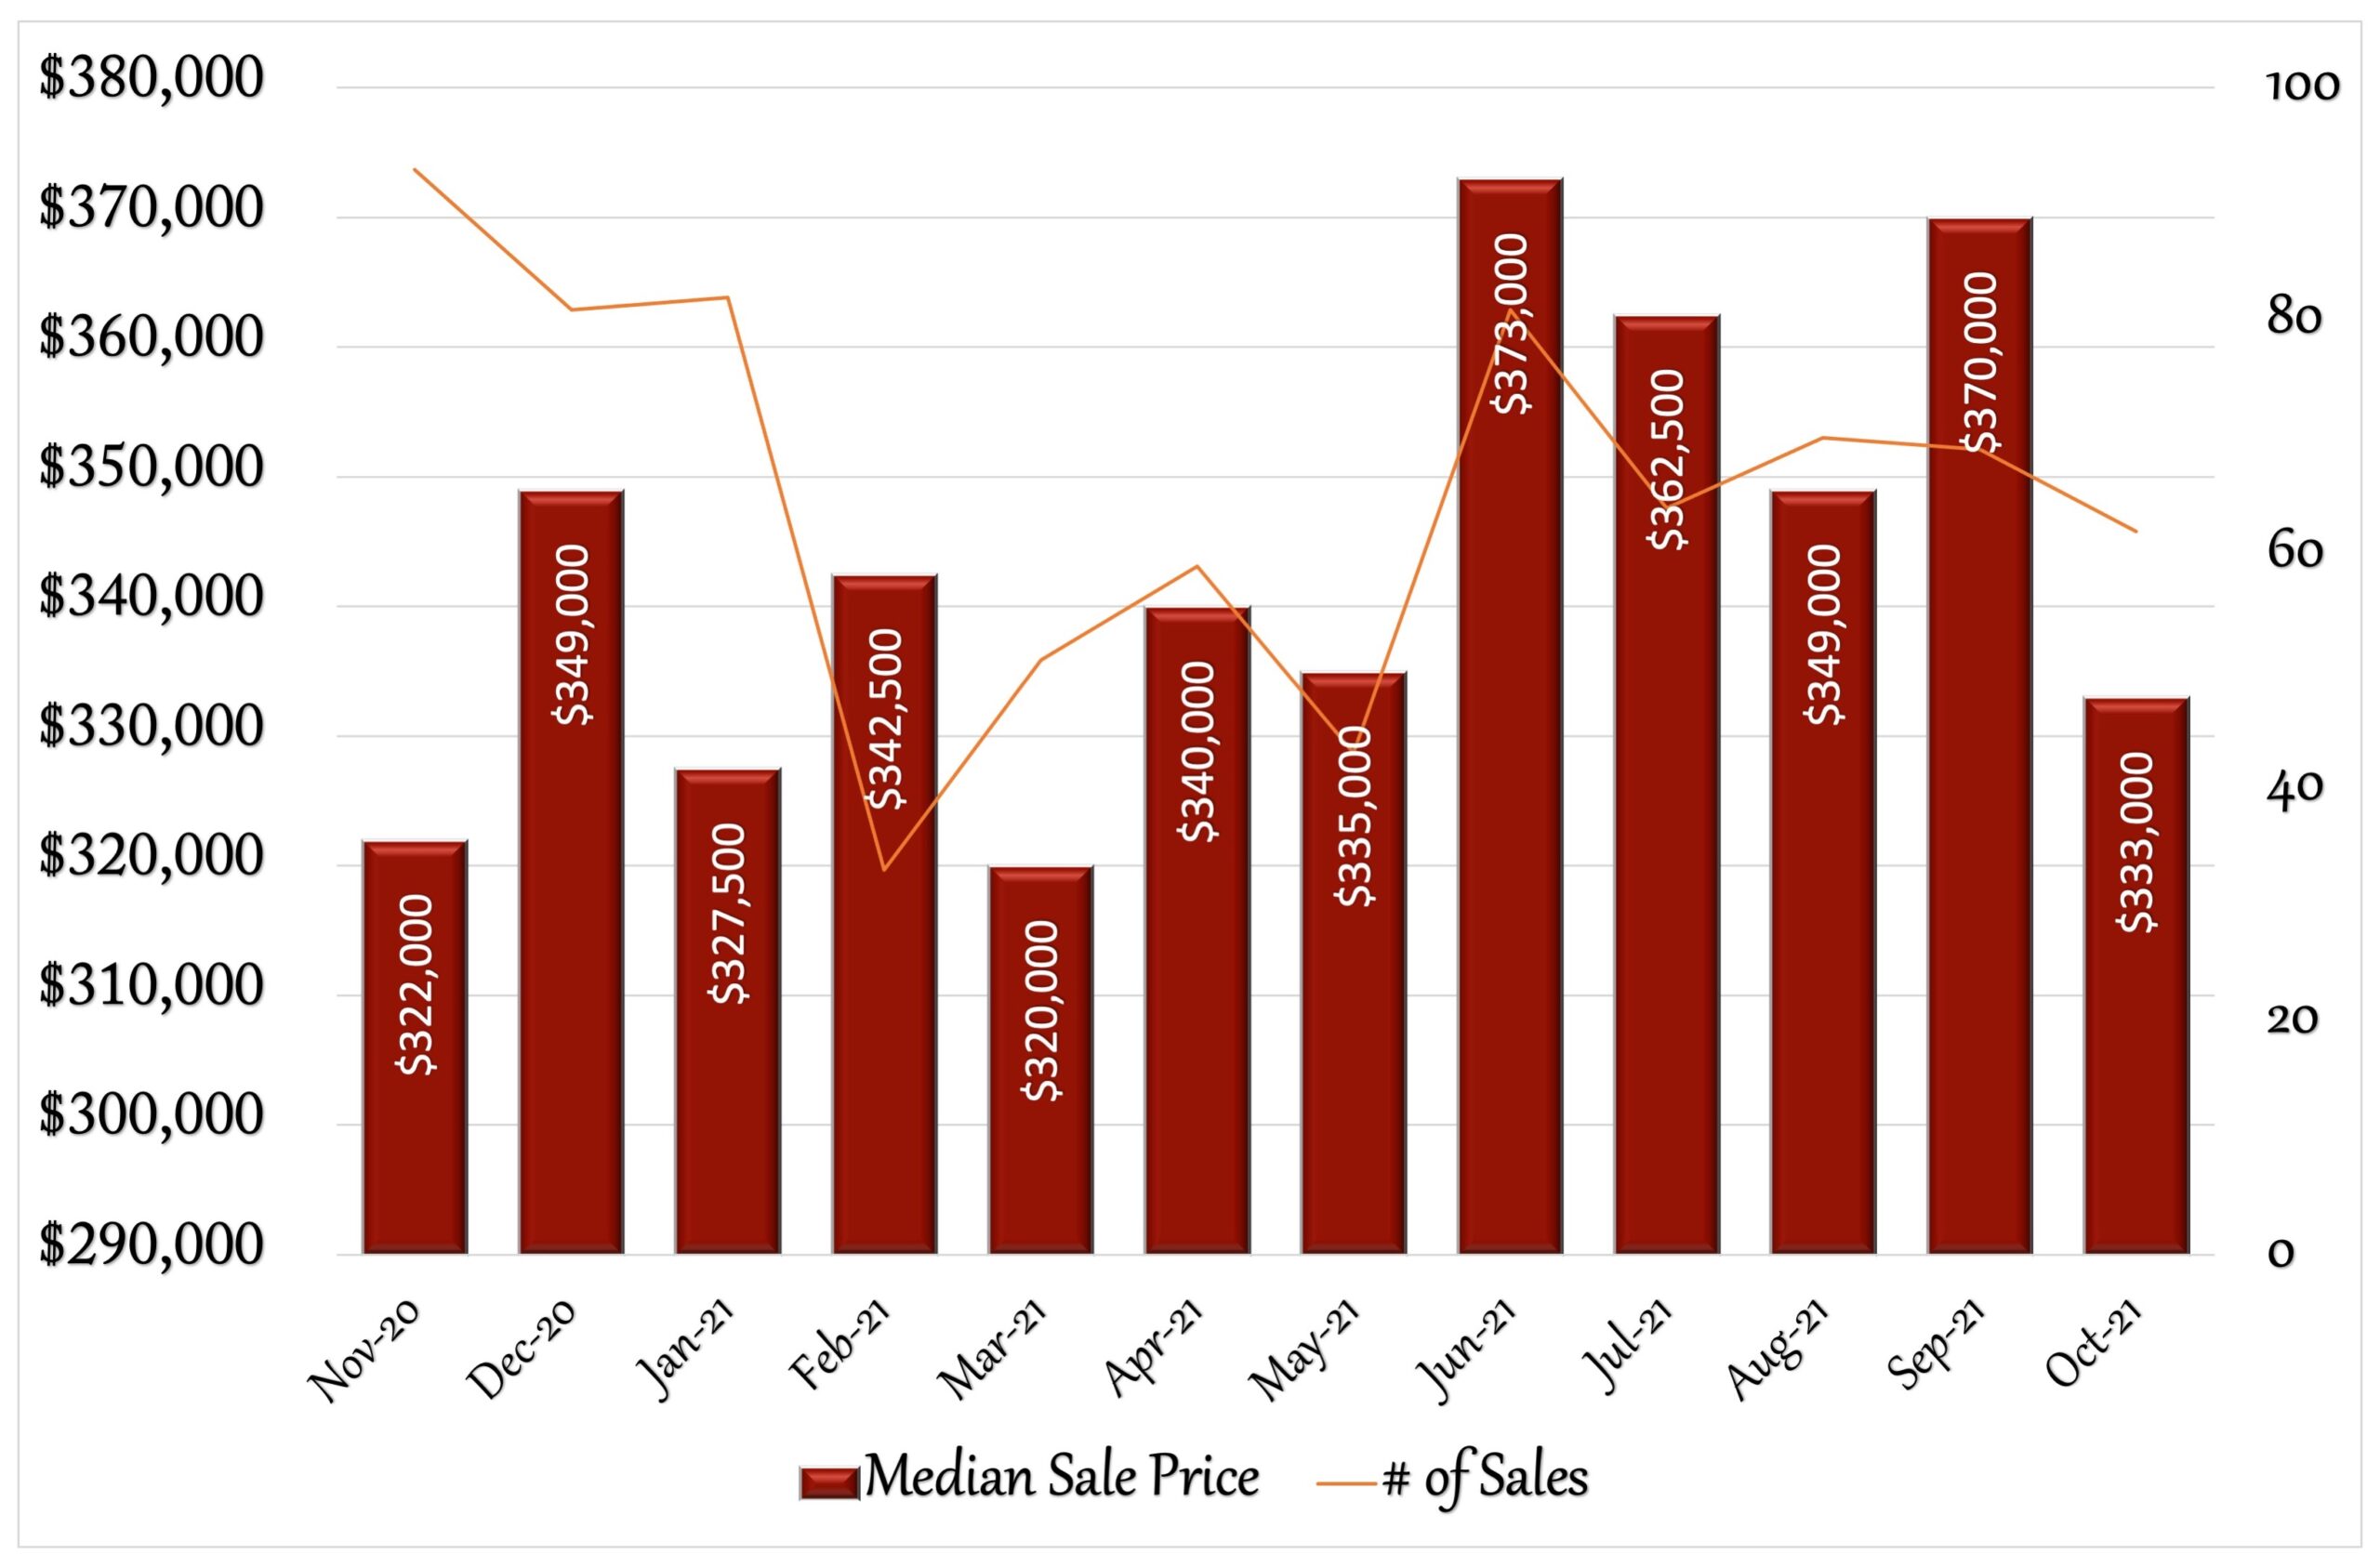
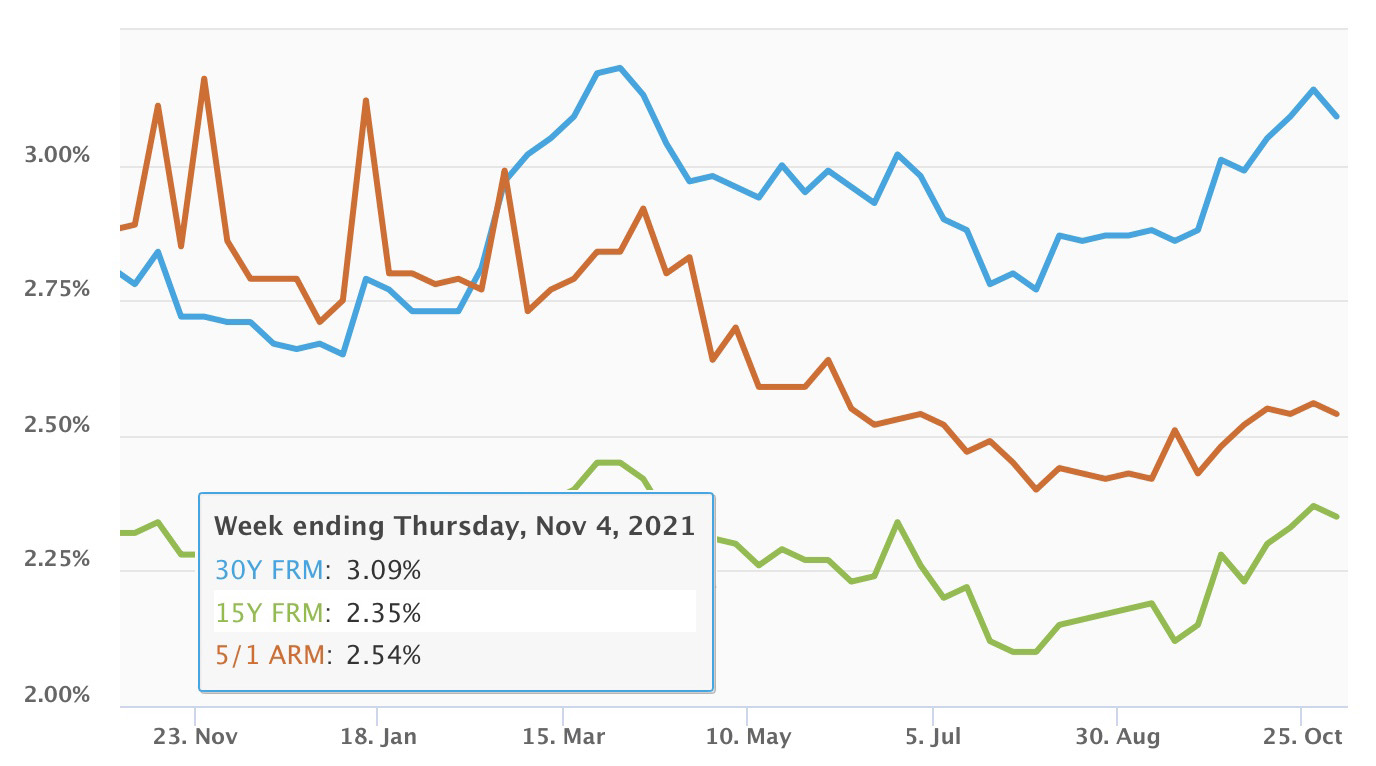
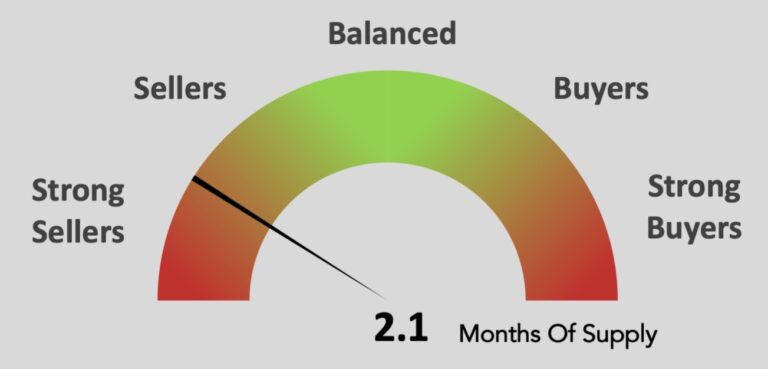
The real estate market in Stratford experienced a slowdown in October when compared to the previous month’s gains. Since June’s peak median sales price of $373,000, prices have been declining each month, save for September. The median sales price in October was down to $333,000 for a single family home. That puts the year to date increase in home values at 1.68% and the 12 month increase at 4.23%. Still, home values in Stratford have been increasing overall quite well since March of 2020, when the median sales price was $245,000. New listings in October were about the same as in September, although the days on market increased from 24 days to 36 days, which illustrates more caution amongst buyers. Stratford is still in a strong seller’s market as the months of supply was at 2.1 months (indicating low inventory), and houses sold on average for a little over 101% of asking price. Pending sales are down slightly from September which could point to another stable month for November. October interest rates still remained fairly low at 3.09% by the end of the month for a 30 year fixed loan, and have dropped to just under 3% by the beginning of November. Experts predict rates to reach the mid 3’s in the coming year, which although higher than most of 2021, still represents an excellent rate for buyers and refinancers and may contribute to a continued strong real estate market in the months ahead. For anyone considering a move, this is still a great time to sell a house in Stratford. Do you know anyone looking for more information about their real estate market? I’d be happy to help.
12 Month Sales Activity
Housing Stats
(change from previous month)
| Median Sale Price: | $333,000 |
| change: | -10.00% |
| YTD change: | 1.68% |
| 12 month change: | 4.23% |
| Units Sold: | 62 |
| change: | -10.14% |
| Active Listings: | 123 |
| change: | -6.11% |
| New Listings: | 75 |
| change: | -1.32% |
| Days on Market: | 36 |
| change: | 50.00% |
| Months of Supply: | 2.10 (Seller's Market) |
| change: | -4.55% |
Interest Rates
Market Temperature
Local Real Estate Price Trends
| 21-Oct | 21-Nov | Change | |
| Bethel | $424,500 | $462,000 | 8.83% |
| Bridgeport | $285,000 | $290,250 | 1.84% |
| Brookfield | $453,500 | $449,000 | -0.99% |
| Danbury | $412,500 | $459,500 | 11.39% |
| Easton | $606,500 | $695,500 | 14.67% |
| Fairfield | $820,000 | $685,000 | -16.46% |
| Milford | $423,500 | $412,500 | -2.60% |
| Monroe | $489,500 | $470,500 | -3.88% |
| Newtown | $360,250 | $512,500 | 42.26% |
| N. Haven | $500,000 | $318,500 | -36.30% |
| Orange | $518,484 | $498,500 | -3.85% |
| Oxford | $476,950 | $462,450 | -3.04% |
| Redding | $590,950 | $640,000 | 8.30% |
| Ridgefield | $775,500 | $800,000 | 3.16% |
| Seymour | $305,000 | $315,450 | 3.43% |
| Shelton | $460,000 | $399,900 | -13.07% |
| Stratford | $370,000 | $333,000 | -10.00% |
| Trumbull | $482,500 | $450,000 | -6.74% |
| Weston | $1,100,000 | $922,500 | -16.14% |
| Westport | $1,525,000 | $1,433,750 | -5.98% |
Tips
Planning for Unexpected Maintenance Issues
Unexpected home maintenance costs have the potential to derail your budget and deplete your savings account. The rule of thumb is to plan on 1% -2% of the home’s value in yearly maintenance costs. Follow these tips to help you prepare for these unexpected expenses.
Add Home Expenses as a Line Item in Your Budget
Set aside whatever you can afford each month into a savings fund for home expenses. Even $50 a month will add up over time and help when unexpected costs arise.
Stay on Top of Repairs
Regular home maintenance can help prevent breakdowns. Change your furnace filters regularly, clean your gutters twice a year, flush the hot water heater yearly and be on the lookout for any sign of water damage. Taking good care of systems and appliances will result in fewer breakdowns.
Get To Know Quality Contractors Ahead Of Time
Planning ahead will lead to less hassle when an urgent repair is necessary. Getting to know contractors you can trust beforehand will save you money by not overpaying for unnecessary repairs. Ask your friends or Realtor for recommendations.
Selling Your Home During the Holidays
Three points to consider when listing your home late in the year:
Some buyers need to make a quick purchase before the end of the year due to a job transfer, estate settlement or other tax-related reason. With so little competition on the market, properties listed during the holiday season tend to sell more quickly and for a higher price.
If you’re worried about moving during the holidays, keep in mind that buyers often need to close by December 31, but they don’t necessarily need to take possession until January. That way, both you and your buyers can enjoy one last holiday season in the old house before making the move.
Of course, one important question is whether you should decorate your home for the holidays. Real estate professionals agree that homes show better with tasteful, festive decorations. Be sensitive to different religions and use seasonal decorations that reflect a fall or winter theme. This will make it easy for buyers to envision having their own holiday celebrations in the home.
Real Estate Headlines
Mortgage Rates Post Temporary Drop: Offering slight relief to home buyers this week, the 30-year fixed-rate mortgage fell to a 2.98% average. But rates may rise again soon. Housing analysts largely expect mortgage rates to increase in the following months due to the Federal Reserve’s announcement this week that it will slowly reduce its monthly bond purchases. Sam Khater, Freddie Mac’s chief economist stated, “The housing market remains favorable for consumers, as rates remain below pre-pandemic levels and continue to support sustainable purchase and refinance opportunities.” NAR forecasts the 30-year fixed-rate mortgage to average 3.5% by the second quarter of 2022.
Home Sale Profit Margins Hit 10-Year High: Home sellers continue to get richer as prices rise. Profit margins on median-priced single-family home and condo sales climbed to 47.6%, which marks the highest level in a decade. The typical home sale nationwide during the third quarter generated a record-high profit of $100,178 as national median home prices continued to rise, ATTOM Data Solutions, a real estate data firm, reports. That is up from $88,800 in the second quarter of this year. Profit margins reflect the change between the median purchase and resale price.
Millennials to Keep Housing Strong for Years to Come: Expanding wealth and growing families are prompting more millennials to become homeowners. Ultra-low mortgage rates are continuing to attract them as well. Young adults ranging from 26 to 41 years old comprise about 22% of the U.S. population. It’s why the housing market has been watching this age segment so closely for so long. More millennials have become homeowners since the pandemic. Millennials have accounted for the largest share of home buyers over the past year—37%, reports Barron’s. Millennials are approaching their peak earning years. “Over the next couple of decades, a quarter of the U.S. population is going to reach peak earning years, fueling continued housing demand—especially for inexpensive starter homes.
Baby Boomers Face Challenges to Downsize: Older home buyers shopping for a smaller home that they will find easier to maintain are struggling to find enough selection in today’s housing market. It’s making downsizing increasingly difficult. Housing inventories for homes that are up to 1,400 square feet have fallen to a 50-year low, according to Freddie Mac, even as a growing number of young couples and aging seniors are competing for them. Price growth has been highest for smaller, less expensive homes. Some baby boomers are choosing to age in place and retrofit their current home so they can stay there longer.
Renters Missed Out on $51K in Equity This Year: Rents have been surging. Since January of this year, the national median rent has climbed by 16.4%. Meanwhile, renters may be missing out on gaining equity. The average homeowner gained about $51,500 in equity over the past year, according to CoreLogic. The higher rent prices are attracting investors, who have been flooding into the market seeing a rising opportunity, particularly single-family rental homes.
Buyers Also Face Competition From Investors: Real estate investors are buying up homes, and first-time buyers increasingly are finding themselves up against them in bidding wars. The share of investors is at the highest level since 2015, according to realtor.com®’s data. They’re most notably targeting the Midwest and Sun Belt, where rental prices are climbing but home prices still remain relatively affordable compared with some other regions of the U.S., realtor.com® says.
Upcoming Events
It’s holiday season, and Connecticut’s venues are ready to help you ring in the season with tree lightings, festivals, holiday music, gift ideas, parades and tons more.
Sales Trends: January - October
October Single-Family Home Sales
(OLP: original list price • LP: list price • SP: sale price • DOM: days on market)
| Address | Style | sq ft | BR | BA (f/h) | OLP | LP | SP | SP/OLP | DOM |
| 45 Boswell St | Ranch, Bungalow | 800 | 2 | 1/0 | $199,000 | $199,000 | $214,000 | 108% | 11 |
| 137 Wood Ave | Colonial | 1,140 | 3 | 1/1 | $310,000 | $310,000 | $310,000 | 100% | 6 |
| 96 Melville St | Colonial | 2,056 | 3 | 1/1 | $369,900 | $349,900 | $342,500 | 93% | 11 |
| 285 Reeds Ln | Colonial | 1,317 | 3 | 1/1 | $354,900 | $354,900 | $385,000 | 108% | 4 |
| 505 Barnum Terrace Ext | Raised Ranch | 2,060 | 4 | 2/0 | $400,000 | $400,000 | $400,000 | 100% | 66 |
| 155 Lambert Dr | Ranch | 1,950 | 3 | 2/0 | $414,900 | $414,900 | $450,000 | 108% | 30 |
| 245 Larkin Ct | Half Duplex | 984 | 2 | 1/0 | $189,999 | $179,999 | $170,000 | 89% | 87 |
| 174 Rockland Ave | Colonial | 1,624 | 3 | 1/1 | $349,900 | $349,900 | $349,900 | 100% | 14 |
| 5 Huntington Rd | Colonial | 1,728 | 3 | 2/0 | $375,000 | $350,000 | $350,000 | 93% | 79 |
| 249 Parkway Dr | Colonial | 1,336 | 2 | 1/0 | $189,900 | $189,900 | $212,000 | 112% | 9 |
| 547 Woodlawn Ave | Colonial | 1,483 | 3 | 2/0 | $343,900 | $309,900 | $258,000 | 75% | 55 |
| 324 Huntington Rd | Colonial | 1,560 | 3 | 2/0 | $299,900 | $299,900 | $316,000 | 105% | 36 |
| 464 Park Blvd | Ranch | 3,617 | 3 | 4/0 | $1,187,000 | $1,187,000 | $975,000 | 82% | 67 |
| 70 McGrath Ct | Half Duplex | 1,278 | 3 | 2/0 | $225,000 | $225,000 | $235,000 | 104% | 62 |
| 843 E. Main St | Cape Cod | 1,824 | 3 | 2/0 | $225,000 | $225,000 | $275,786 | 123% | 7 |
| 91 Academy Hill Ter | Colonial | 2,070 | 3 | 1/1 | $349,900 | $299,900 | $295,000 | 84% | 100 |
| 85 Carol Rd | Ranch | 1,385 | 4 | 1/0 | $325,000 | $315,000 | $305,000 | 94% | 16 |
| 335 Seabreeze Dr | Ranch | 1,546 | 3 | 1/1 | $369,000 | $369,000 | $390,000 | 106% | 63 |
| 184 Allyndale Dr | Colonial | 1,587 | 3 | 1/1 | $375,000 | $375,000 | $400,000 | 107% | 42 |
| 90 Mapledale Ave | Ranch | 1,264 | 3 | 2/1 | $399,900 | $399,900 | $465,000 | 116% | 6 |
| 80 Deerfield Dr | Ranch | 1,964 | 3 | 2/1 | $449,000 | $449,000 | $475,000 | 106% | 54 |
| 230 Marcroft St | Cape Cod | 1,659 | 3 | 1/0 | $278,000 | $278,000 | $280,000 | 101% | 223 |
| 85-95 Chapel St | Colonial, Farm House | 3,000 | 4 | 2/2 | $509,000 | $509,000 | $455,000 | 89% | 32 |
| 40 Perry Ln | Colonial | 2,700 | 3 | 3/1 | $589,900 | $589,900 | $589,900 | 100% | 68 |
| 458 Jackson Ave | Bungalow | 670 | 2 | 1/0 | $129,000 | $129,000 | $120,000 | 93% | 69 |
| 5 Knowlton St | Cape Cod | 1,215 | 4 | 1/0 | $279,900 | $249,900 | $250,000 | 89% | 102 |
| 676 Columbus Ave | Half Duplex | 1,133 | 3 | 1/0 | $189,900 | $189,900 | $190,000 | 100% | 82 |
| 310 Carol Rd | Ranch | 1,460 | 3 | 1/0 | $240,000 | $240,000 | $225,000 | 94% | 70 |
| 255 Rockland Ave | Ranch | 1,043 | 3 | 1/0 | $269,900 | $269,900 | $290,000 | 107% | 5 |
| 700 Wigwam Ln | Colonial | 1,349 | 3 | 1/1 | $319,900 | $319,900 | $331,000 | 103% | 3 |
| 124 Ulrich Rd | Colonial | 1,708 | 3 | 1/1 | $359,900 | $359,900 | $355,000 | 99% | 69 |
| 195 Meadowbrook Rd | Cape Cod | 1,577 | 3 | 1/0 | $362,500 | $362,500 | $363,000 | 100% | 26 |
| 95 Edgewood St | Cape Cod | 2,407 | 3 | 2/0 | $345,000 | $345,000 | $370,000 | 107% | 64 |
| 460 Nutmeg Ln, Unit #460 | Colonial | 2,494 | 4 | 2/1 | $539,900 | $539,900 | $550,000 | 102% | 26 |
| 84 Temple St | Colonial | 2,028 | 3 | 2/0 | $260,000 | $280,000 | $300,000 | 115% | 9 |
| 675 Hilltop Dr | Colonial | 2,092 | 4 | 2/0 | $448,900 | $448,900 | $438,000 | 98% | 6 |
| 26 Porter St | Hi-Ranch | 1,002 | 3 | 2/0 | $289,900 | $289,900 | $290,000 | 100% | 74 |
| 915 Cutspring Rd | Colonial | 1,380 | 3 | 1/1 | $319,900 | $319,900 | $319,900 | 100% | 4 |
| 695 Hilltop Dr | Cape Cod | 1,648 | 3 | 2/0 | $385,000 | $385,000 | $387,500 | 101% | 28 |
| 142 Plymouth St | Colonial | 1,429 | 3 | 1/1 | $327,900 | $349,500 | $335,000 | 102% | 202 |
| 571 Barnum Terrace Ext | Cape Cod | 2,109 | 4 | 2/0 | $349,900 | $349,900 | $360,000 | 103% | 90 |
| 57 Oceanview Ter | Cape Cod | 1,920 | 3 | 1/0 | $375,000 | $375,000 | $390,000 | 104% | 73 |
| 55 Post Oak Rd | Raised Ranch | 1,951 | 3 | 2/0 | $389,900 | $389,900 | $406,000 | 104% | 41 |
| 105 Speer Dr | Colonial | 3,144 | 4 | 2/1 | $529,900 | $499,900 | $489,900 | 92% | 99 |
| 100 Perry Ln | Colonial | 2,637 | 4 | 2/1 | $579,900 | $579,900 | $595,000 | 103% | 1 |
| 50 Adams St | Ranch | 1,956 | 2 | 1/1 | $259,000 | $259,000 | $270,000 | 104% | 48 |
| 301 Harding Ave | Cape Cod | 1,292 | 4 | 3/0 | $329,000 | $319,000 | $319,000 | 97% | 9 |
| 310 Castle Dr | Cape Cod | 1,379 | 4 | 2/0 | $375,000 | $355,000 | $355,000 | 95% | 35 |
| 160 Perry Ln | Colonial | 3,822 | 4 | 2/1 | $599,999 | $599,999 | $615,000 | 103% | 13 |
| 323 Honeyspot Rd | Bungalow | 984 | 3 | 1/0 | $275,000 | $265,000 | $260,000 | 95% | 23 |
| 394 Hilltop Dr | Cape Cod | 1,939 | 3 | 2/1 | $459,000 | $449,000 | $465,000 | 101% | 21 |
| 304 Park St | Bungalow | 1,328 | 3 | 1/0 | $194,900 | $194,900 | $195,000 | 100% | 4 |
| 95 Wainwright Pl | Cape Cod | 1,454 | 4 | 2/0 | $299,900 | $299,900 | $323,000 | 108% | 7 |
| 71 Vernon St | Colonial | 1,842 | 3 | 1/1 | $189,900 | $189,900 | $225,900 | 119% | 4 |
| 160 Claudia Dr | Cape Cod | 1,287 | 4 | 1/1 | $319,900 | $319,900 | $330,000 | 103% | 120 |
| 37 Derby Pl | Split Level | 2,246 | 3 | 2/0 | $410,000 | $410,000 | $430,000 | 105% | 35 |
| 130 Sedgewick Ave | Colonial | 1,030 | 2 | 1/0 | $220,000 | $220,000 | $220,000 | 100% | 9 |
| 80 Avon St | Colonial, Cottage | 1,015 | 3 | 1/0 | $254,900 | $244,900 | $245,000 | 96% | 78 |
| 40 Boswell St | Cape Cod | 1,267 | 3 | 1/0 | $279,000 | $279,000 | $267,000 | 96% | 6 |
| 156 Fairview Ave | Cape Cod | 1,320 | 3 | 1/0 | $329,900 | $329,900 | $330,000 | 100% | 7 |
| 25 Kovach Dr | Ranch | 1,382 | 3 | 2/0 | $374,900 | $374,900 | $401,023 | 107% | 65 |
| 95 Perry Ln | Colonial | 3,337 | 4 | 3/1 | $629,900 | $629,900 | $619,900 | 98% | 56 |
| Units Sold: 62 | $344,450 | $337,450 | $333,000 | 100% | 35 |
Are You Interested In A Real Estate Review?
“There is only one way to look at things, until someone shows us how to look at them with different eyes.” -Pablo Picasso