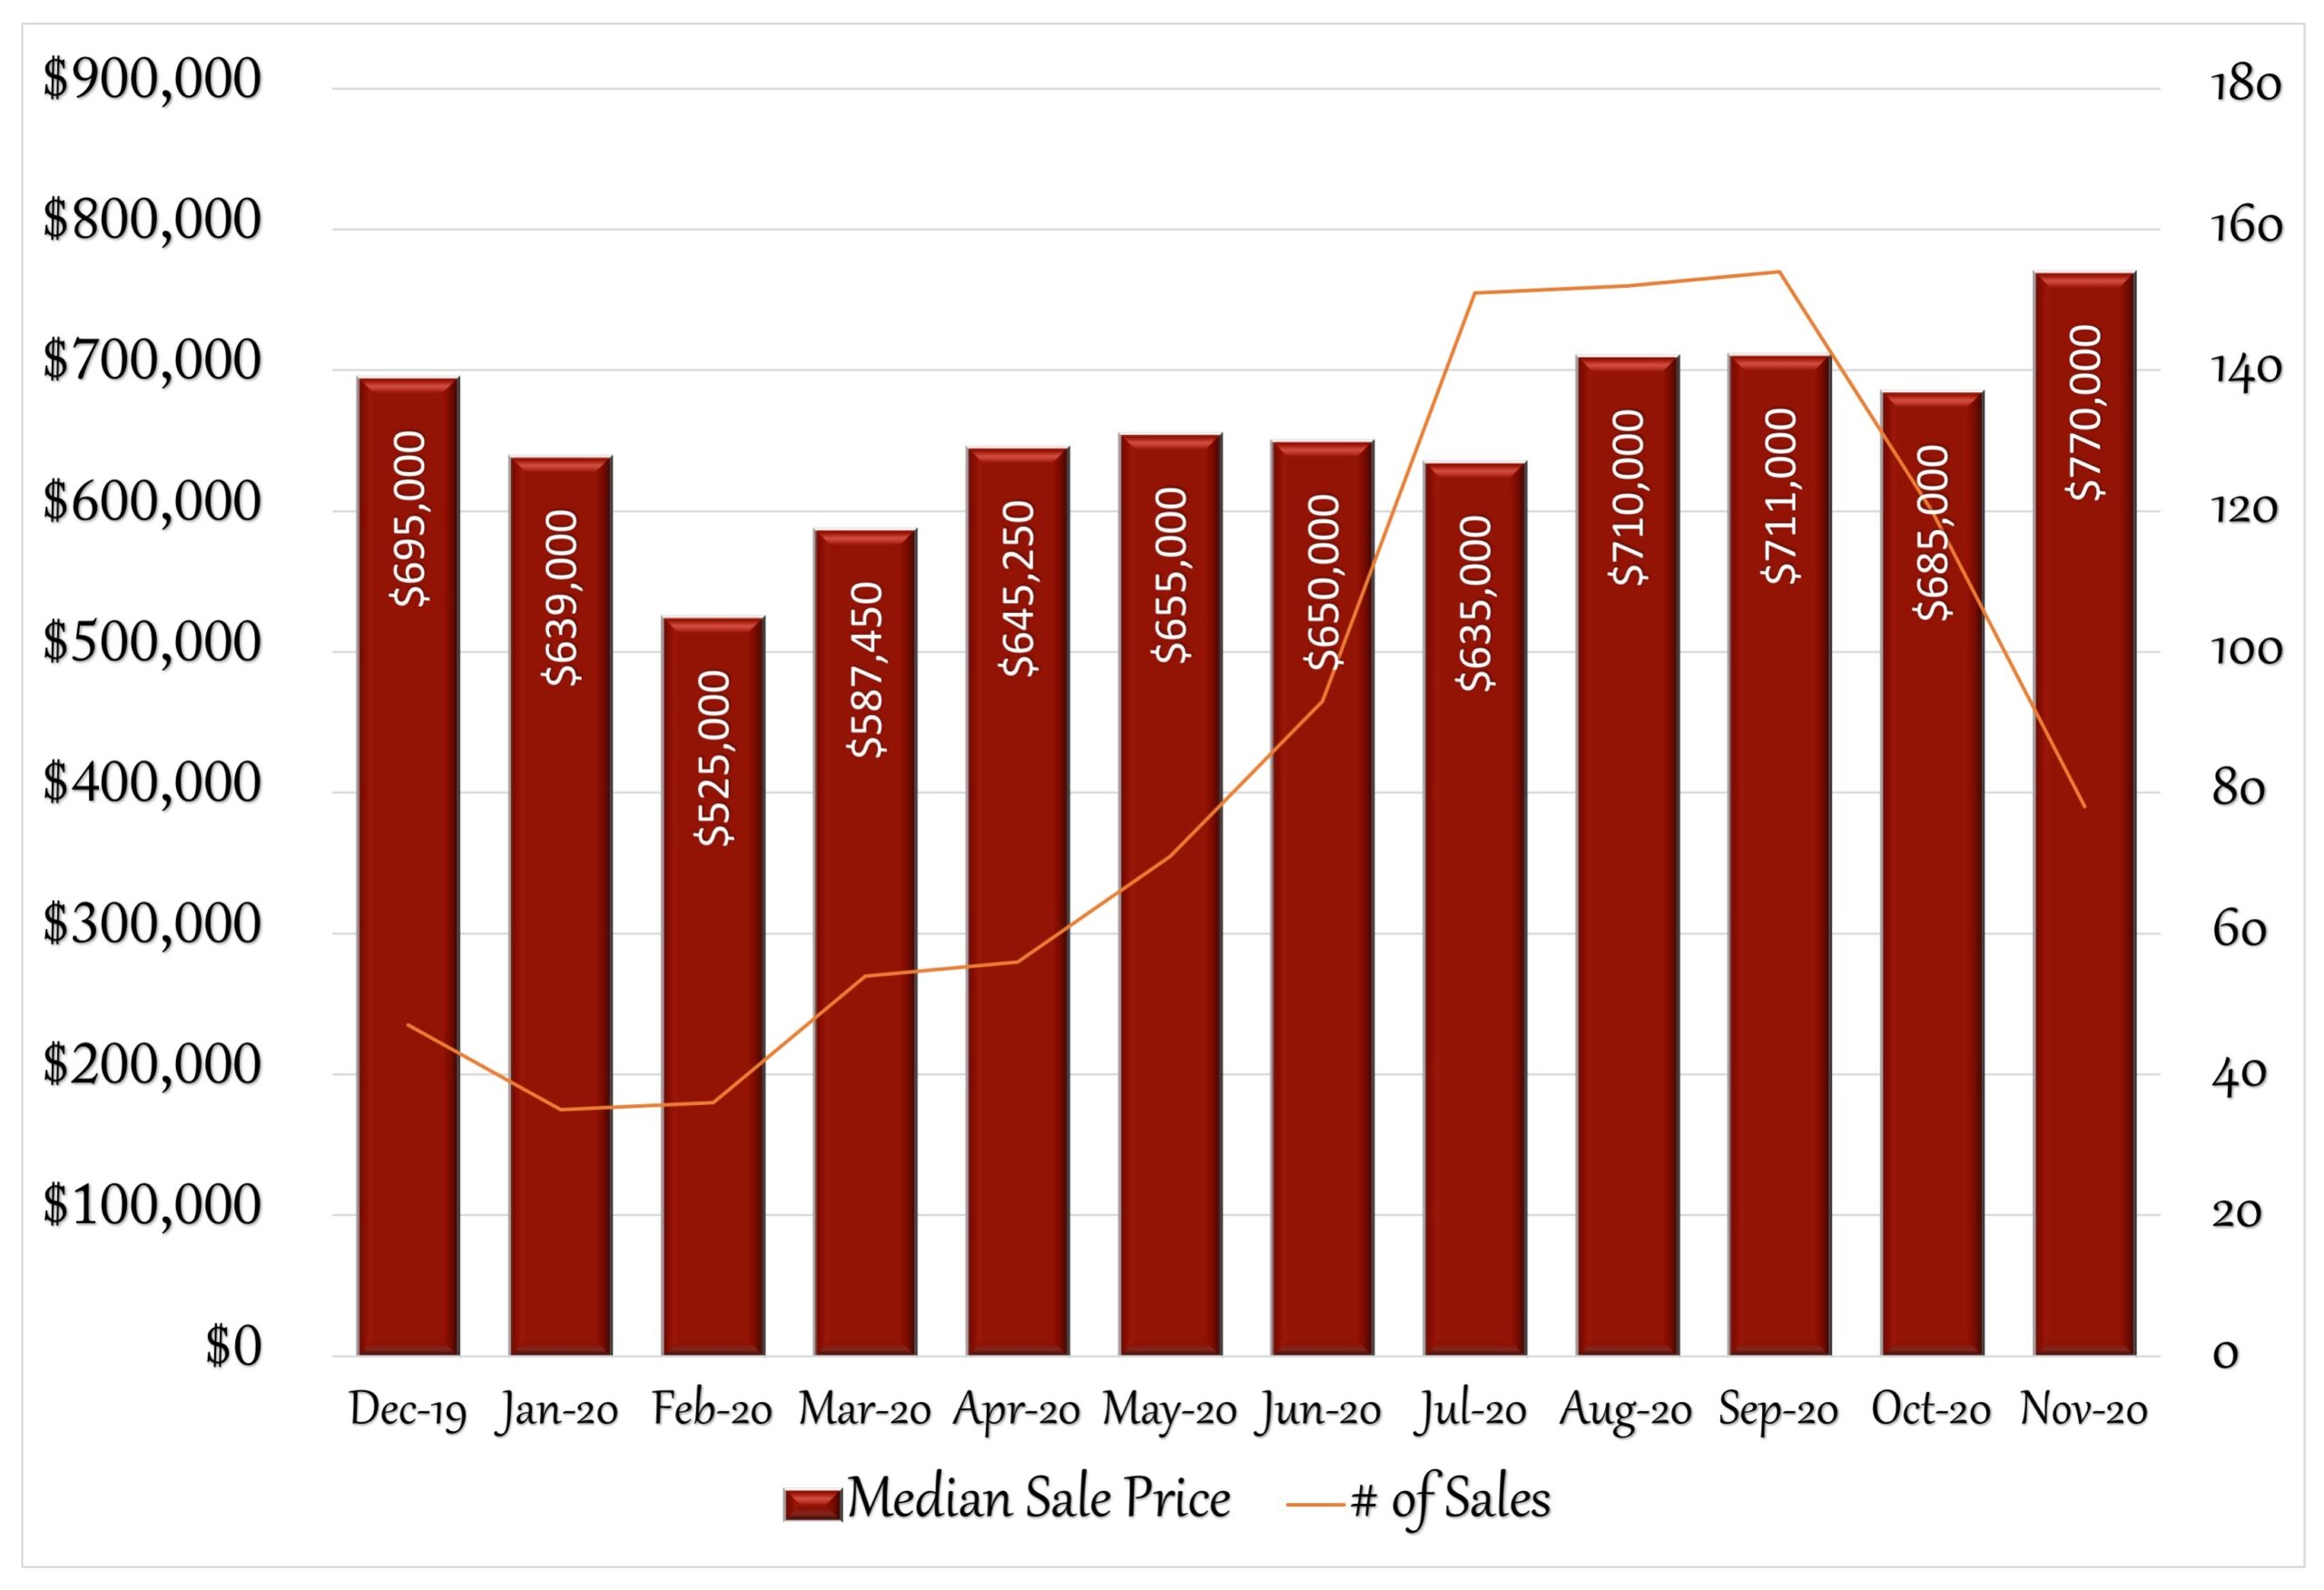
November proved to be a strong month for real estate in Fairfield. The median sales price, which had dropped in October, rebounded sharply by 12%, to $770,000. For the year, that’s an increase of over 20%! Sales activity slowed however, as the number of houses sold dropped from 120 to 78, and the number of new listings also dropped; from 116 to 76 for the month. Even with the higher sales price and lower number of sales, buyer activity was brisk, as the days on market dropped 16% to just 42 days. With pending sales also down for the month, future sales activity may be beginning to level out. However, Fairfield is still experiencing a sellers-market, which is expected to continue into 2021 as available inventory, at 250 homes for sale, remains scarce. By comparison, in November of 2018 and 2019 there were 445 and 427 houses for sale respectively. Continued low interest rates will also contribute to a sellers-market. The 30yr fixed rate reached another record breaking low of 2.71% by the end of November. This is still a great time to sell a home, and with low interest rates, a good time to buy. Do you know anyone looking for more information about their real estate market? I’d be happy to help.
12 Month Sales Activity
Housing Stats
(change from previous month)
| Median Sale Price: | $770,000 |
| change: | 12.41% |
| YTD change: | 20.50% |
| Units Sold: | 78 |
| change: | -35.00% |
| Active Listings: | 250 |
| change: | -3.10% |
| New Listings: | 76 |
| change: | -34.48% |
| Days on Market: | 42 |
| change: | -16.00% |
| Months of Supply: | 3.90 (Seller's Market) |
| change: | 34.48% |

Economic News:
Stock Market: November saw all three major US markets rise sharply, as investors were encouraged with the news of two coronavirus vaccines showing favorable trial results, even while new cases continued to rise. The NASDEQ was up11.9%, S&P 500 up 10.75% and the Dow Jones was up 11.84%.
Employment: Employment rose by 245,000 jobs in November, and the unemployment rate lowered slightly to 6.7%, according to the U.S. Bureau of Labor Statistics. These improvements in the labor market reflect the continued resumption of economic activity that had been curtailed due to the coronavirus (COVID-19) pandemic and efforts to contain it. In November, notable job gains occurred in transportation and warehousing, professional and business services, and health care, while employment declined in government and retail trade.
Real Estate: According to realtor.com’s 2021 housing forcast, the current seller’s market is likely to continue. Low inventory and interest rates combined with strong buyer competition will continue to drive prices upwards. Buyers will suffer from low inventory, as higher prices will erase gains ofset by low interest rates, challenging affordability.
2020 Local Real Estate Price Trends:
November was another great month for home sales prices. Year-to-date median sales prices continued to be on the rise for most local towns when compared to 2019’s first 11 months. All towns show increases in median sales price, with many over 10%.
| 1/19-11/19 | 1/20-11/20 | Change | |
| Bethel | $345,000 | $386,550 | 12.04% |
| Bridgeport | $204,000 | $240,000 | 17.65% |
| Easton | $562,500 | $579,000 | 2.93% |
| Fairfield | $580,000 | $665,000 | 14.66% |
| Milford | $305,000 | $350,000 | 14.75% |
| Monroe | $362,500 | $412,500 | 13.79% |
| Newtown | $380,100 | $430,000 | 13.13% |
| Norwalk | $485,128 | $535,000 | 10.28% |
| Orange | $375,000 | $385,500 | 2.80% |
| Redding | $527,000 | $560,500 | 6.36% |
| Ridgefield | $628,250 | $699,000 | 11.26% |
| Shelton | $339,000 | $377,000 | 11.21% |
| Stratford | $250,000 | $291,000 | 16.40% |
| Trumbull | $385,000 | $430,000 | 11.69% |
| Weston | $685,000 | $805,000 | 17.52% |
| Westport | $1,142,857 | $1,341,000 | 17.34% |
| Wilton | $697,500 | $800,500 | 14.77% |
Improvements for First Time Homeowners:


Prices For Fences On The Rise:
With the pandemic, homeowners are seeking more privacy and security. The demand for fences has driven up prices. Since the begining of 2020, the price for pressure treated wood as more than doubled.
Fairfield Sales Trends: January-November
November Single-Family Home Sales
(OLP: original list price • LP: list price • SP: sale price • DOM: days on market)
| Address | Style | sq ft | BR | BA (f/h) | OLP | LP | SP | SP/OLP | DOM |
| 41 Four Seasons Rd | Ranch | 3,100 | 4 | 3/0 | $649,000 | $649,000 | $679,000 | 105% | 15 |
| 187 Kings Dr | Colonial | 4,200 | 5 | 5/1 | $1,399,000 | $1,249,999 | $1,150,000 | 82% | 153 |
| 41 River Ln | Colonial | 3,056 | 4 | 3/1 | $1,395,000 | $1,395,000 | $1,325,000 | 95% | 210 |
| 891 Fairfield Beach Rd | Colonial | 3,444 | 4 | 4/0 | $2,589,000 | $2,589,000 | $2,700,000 | 104% | 21 |
| 668 Bronson Rd | Colonial | 2,474 | 5 | 4/1 | $600,000 | $600,000 | $600,000 | 100% | 1 |
| 253 Home St | Colonial | 3,143 | 4 | 3/1 | $789,900 | $759,000 | $750,000 | 95% | 188 |
| 167 Collingwood Ave | Colonial, Tudor | 5,216 | 6 | 3/2 | $1,250,000 | $1,250,000 | $1,275,000 | 102% | 72 |
| 27 Southfield Rd | Colonial | 2,300 | 3 | 2/1 | $899,000 | $899,000 | $899,000 | 100% | 35 |
| 831 Fairfield Beach Rd | Colonial | 5,800 | 5 | 5/1 | $4,495,000 | $4,495,000 | $4,150,000 | 92% | 87 |
| 672 High St | Ranch | 768 | 2 | 1/0 | $250,000 | $250,000 | $250,000 | 100% | 0 |
| 437 High St | Cape Cod | 1,560 | 3 | 2/0 | $348,500 | $348,500 | $340,000 | 98% | 33 |
| 53 Baldwin Ter | Ranch | 768 | 2 | 1/0 | $449,900 | $449,900 | $455,000 | 101% | 41 |
| 116 Frog Pond Ln | Colonial | 4,018 | 4 | 2/1 | $995,000 | $899,000 | $899,000 | 90% | 177 |
| 43 Puritan Rd | Colonial | 4,418 | 5 | 5/1 | $1,899,000 | $1,899,000 | $1,900,000 | 100% | 41 |
| 632 Jennings Rd | Colonial | 1,267 | 3 | 1/1 | $349,000 | $319,000 | $319,000 | 91% | 21 |
| 251 N. Pine Creek Rd | Ranch | 864 | 2 | 1/0 | $399,900 | $399,900 | $400,000 | 100% | 23 |
| 537 Toll House Ln | Ranch, Split Level | 2,536 | 3 | 2/1 | $546,500 | $546,500 | $535,000 | 98% | 76 |
| 21 Orchard Hill Dr | Colonial | 3,361 | 4 | 2/1 | $835,000 | $810,000 | $790,000 | 95% | 42 |
| 605 Brooklawn Ave | Colonial | 3,098 | 6 | 3/1 | $785,000 | $785,000 | $815,000 | 104% | 55 |
| 383 Old Post Rd | Colonial, Contemporary | 3,762 | 3 | 2/1 | $1,495,000 | $1,495,000 | $1,400,000 | 94% | 42 |
| 63 Camden St | Cape Cod | 1,096 | 3 | 2/0 | $269,000 | $239,000 | $239,000 | 89% | 78 |
| 273 Pemburn Dr | Ranch | 2,576 | 2 | 2/1 | $430,000 | $430,000 | $451,000 | 105% | 32 |
| 38 Sawyer Rd | Cape Cod | 1,825 | 4 | 2/0 | $519,500 | $499,500 | $475,000 | 91% | 225 |
| 205 Primrose Ln | Colonial | 3,612 | 4 | 2/1 | $739,000 | $739,000 | $739,000 | 100% | 26 |
| 590 Tahmore Dr | Colonial | 3,272 | 5 | 3/2 | $999,999 | $999,999 | $984,000 | 98% | 21 |
| 680 Bronson Rd | Other | 1,877 | 3 | 2/0 | $449,000 | $449,000 | $411,100 | 92% | 47 |
| 146 Chelsea St | Cape Cod | 1,699 | 3 | 3/1 | $529,900 | $529,900 | $530,900 | 100% | 35 |
| 165 Old Spring Rd | Cape Cod | 1,679 | 3 | 1/1 | $409,000 | $409,000 | $405,000 | 99% | 68 |
| 281 Fairview Ave | Colonial | 1,953 | 4 | 3/0 | $600,000 | $569,000 | $553,500 | 92% | 120 |
| 233 S. Benson Rd | Colonial, Farm House | 1,800 | 3 | 1/1 | $719,000 | $709,000 | $692,500 | 96% | 35 |
| 211 Harbor Rd | Colonial | 3,654 | 4 | 4/1 | $3,395,000 | $3,395,000 | $3,200,000 | 94% | 138 |
| 161 Crestwood Rd | Colonial | 1,506 | 2 | 1/0 | $449,000 | $449,000 | $460,000 | 102% | 27 |
| 197 Riverview Cir | Cape Cod | 1,614 | 4 | 1/1 | $459,000 | $459,000 | $474,100 | 103% | 4 |
| 219 Godfrey Rd | Cape Cod, Ranch | 2,452 | 3 | 2/0 | $549,000 | $549,000 | $575,000 | 105% | 35 |
| 218 Verna Hill Rd | Colonial | 2,702 | 4 | 3/1 | $879,000 | $879,000 | $867,500 | 99% | 95 |
| 430 Mill Hill Ter | Colonial | 3,206 | 4 | 3/0 | $949,000 | $949,000 | $980,000 | 103% | 27 |
| 49 Norcliff Ln | Colonial | 2,974 | 3 | 3/0 | $1,499,000 | $1,499,000 | $1,605,000 | 107% | 8 |
| 591 Church Hill Rd | Ranch | 1,926 | 3 | 3/0 | $469,900 | $469,900 | $469,900 | 100% | 27 |
| 820 Sturges Rd | Cape Cod | 2,104 | 4 | 2/1 | $675,000 | $595,000 | $560,000 | 83% | 57 |
| 33 Ermine St | Cape Cod | 3,362 | 4 | 3/1 | $699,000 | $699,000 | $665,000 | 95% | 70 |
| 471 Hill Farm Rd | Colonial | 2,452 | 4 | 2/1 | $749,000 | $749,000 | $735,000 | 98% | 22 |
| 552 Hoydens Hill Rd | Contemporary | 4,290 | 4 | 3/1 | $875,000 | $969,000 | $969,000 | 111% | 157 |
| 1084 Fairfield Beach Rd | Cottage | 1,520 | 3 | 2/0 | $1,000,000 | $1,000,000 | $985,000 | 99% | 34 |
| 150 Acorn Ln | Colonial | 5,381 | 6 | 5/1 | $1,450,000 | $1,397,000 | $1,325,000 | 91% | 80 |
| 3470 Congress St | Colonial | 5,979 | 5 | 5/1 | $1,429,000 | $1,399,000 | $1,380,000 | 97% | 104 |
| 10 Green Acre Ln | Colonial | 1,564 | 3 | 1/1 | $485,000 | $485,000 | $455,000 | 94% | 26 |
| 184 Buena Vista Rd | Colonial | 2,016 | 3 | 2/0 | $539,000 | $539,000 | $539,000 | 100% | 0 |
| 2062 N. Benson Rd | Colonial | 3,296 | 4 | 3/1 | $725,000 | $725,000 | $715,000 | 99% | 28 |
| 1459 Mill Plain Rd | Colonial | 2,969 | 5 | 4/0 | $850,000 | $850,000 | $820,000 | 96% | 55 |
| 509 Old Mill Rd | Cape Cod | 2,234 | 3 | 2/0 | $915,000 | $895,000 | $872,000 | 95% | 92 |
| 60 Old Academy Rd | Colonial | 4,040 | 5 | 3/1 | $925,000 | $925,000 | $925,000 | 100% | 32 |
| 493 Rolling Hills Dr | Colonial | 4,784 | 5 | 3/1 | $1,100,000 | $1,100,000 | $1,100,000 | 100% | 29 |
| 240 Foggwood Rd | Ranch, Cottage | 3,775 | 3 | 4/1 | $1,265,000 | $1,265,000 | $1,275,000 | 101% | 28 |
| 1240 Fairfield Beach Rd, Unit #1240 | Chalet, Cottage | 1,105 | 3 | 2/0 | $728,000 | $728,000 | $728,000 | 100% | 30 |
| 5 Sherley Pl | Colonial | 2,338 | 4 | 2/1 | $595,000 | $595,000 | $570,000 | 96% | 42 |
| 97 Hunter Rd | Colonial | 3,090 | 4 | 2/1 | $825,000 | $799,000 | $799,000 | 97% | 32 |
| 157 Toilsome Hill Rd | Colonial | 4,292 | 4 | 2/2 | $950,000 | $917,000 | $845,000 | 89% | 69 |
| 2745 Burr St | Colonial | 4,215 | 5 | 3/1 | $1,100,000 | $1,100,000 | $1,001,500 | 91% | 93 |
| 145 Ivy Ln | Colonial | 4,086 | 4 | 3/1 | $1,229,000 | $1,229,000 | $1,270,000 | 103% | 46 |
| 138 S. Gate Ln | Colonial | 6,534 | 5 | 7/2 | $2,299,000 | $2,299,000 | $2,299,000 | 100% | 92 |
| 406 Stratfield Rd | Colonial | 3,249 | 4 | 2/0 | $582,000 | $582,000 | $604,060 | 104% | 21 |
| 406 Stratfield Rd | Colonial | 3,249 | 4 | 2/0 | $582,000 | $582,000 | $604,060 | 104% | 21 |
| 840 Church Hill Rd | Ranch | 2,092 | 3 | 3/0 | $489,000 | $489,000 | $465,000 | 95% | 28 |
| 350 Bennett St | Raised Ranch, Hi-Ranch | 1,948 | 4 | 2/1 | $569,900 | $569,900 | $586,000 | 103% | 4 |
| 969 Powder Horn Ln | Colonial | 1,768 | 3 | 2/1 | $650,000 | $650,000 | $635,000 | 98% | 31 |
| 175 Wellington Dr | Colonial | 4,062 | 5 | 3/1 | $959,900 | $959,900 | $940,000 | 98% | 46 |
| 1022 Mill Hill Rd | Colonial | 3,237 | 4 | 2/1 | $989,000 | $989,000 | $989,500 | 100% | 82 |
| 106 Charles St | Colonial | 3,000 | 4 | 4/1 | $1,275,000 | $1,275,000 | $1,200,000 | 94% | 156 |
| 635 Stillson Rd | Cape Cod | 1,338 | 4 | 2/0 | $519,000 | $519,000 | $510,000 | 98% | 24 |
| 188 Verna Hill Rd | Colonial | 2,909 | 4 | 3/1 | $975,000 | $975,000 | $1,026,000 | 105% | 26 |
| 131 Royal Ave | Colonial | 615 | 2 | 1/0 | $229,900 | $219,900 | $201,000 | 87% | 47 |
| 410 Old Hickory Rd | Raised Ranch | 2,416 | 4 | 2/1 | $647,500 | $629,990 | $590,000 | 91% | 224 |
| 28 Robson Pl | Colonial | 2,093 | 3 | 1/1 | $695,000 | $695,000 | $595,000 | 86% | 43 |
| 125 Paddock Hill Ln | Contemporary | 11,065 | 5 | 6/2 | $995,000 | $799,000 | $650,000 | 65% | 220 |
| 842 Redding Rd | Colonial | 4,072 | 5 | 5/1 | $1,000,000 | $1,000,000 | $1,055,000 | 106% | 107 |
| 259 Somerset Ave | Colonial | 3,824 | 5 | 3/1 | $1,099,000 | $1,099,000 | $1,085,000 | 99% | 52 |
| 901 Fairfield Beach Rd | Colonial | 3,038 | 5 | 3/1 | $2,199,000 | $2,199,000 | $2,127,000 | 97% | 69 |
| 1021 Fairfield Beach Rd | Contemporary, Modern | 2,652 | 3 | 2/1 | $1,995,000 | $1,995,000 | $1,795,000 | 90% | 137 |
| Units Sold: 78 | $787,450 | $772,000 | $744,500 | 98% | 42 |