
Serving New Haven and Fairfield Counties | Contact: (203) 895-2783
Menu
Menu
Fairfield Market Report February 2022
Market Overview
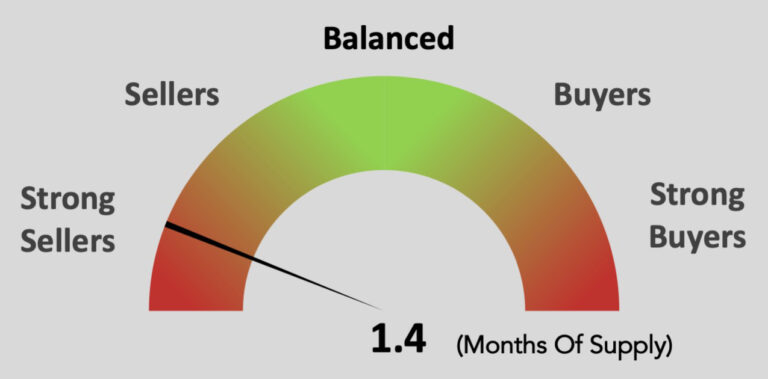
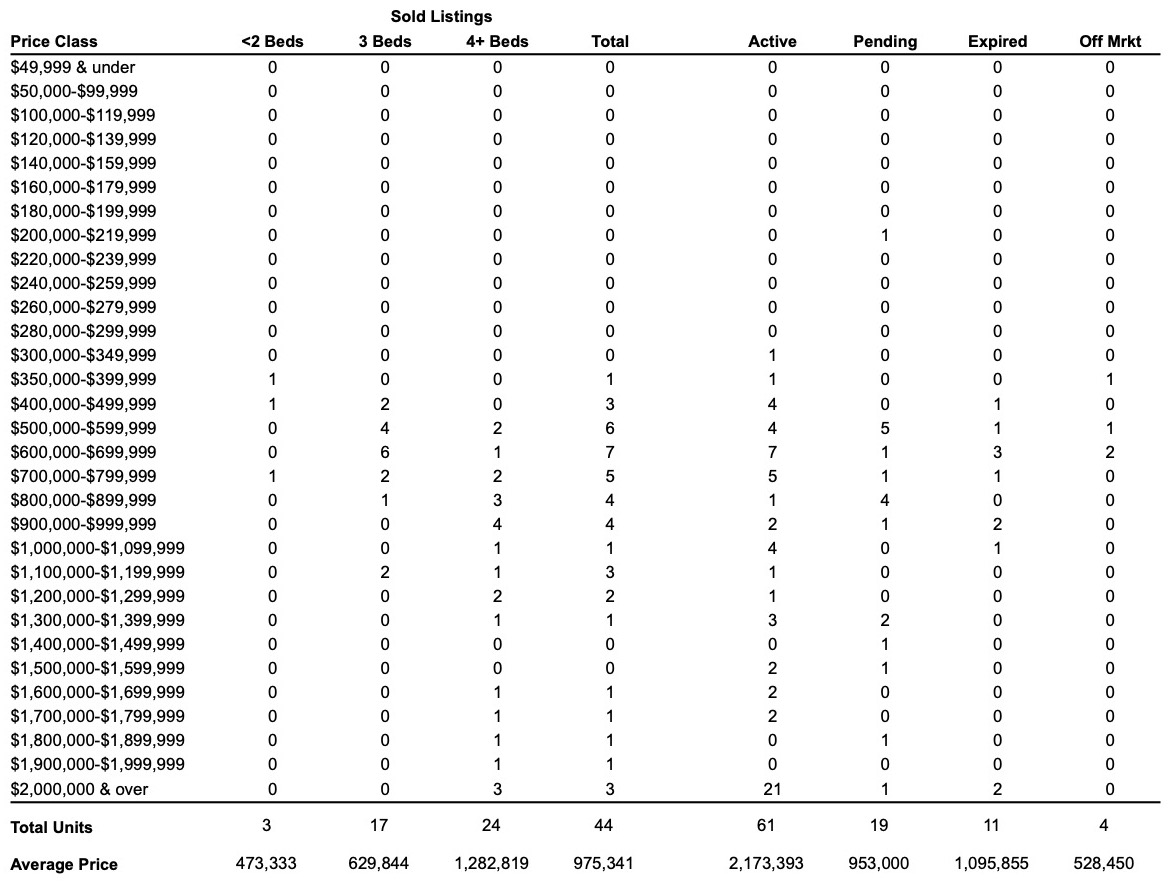
January proved to be another positive month for the Fairfield’s home values. The median sales price of a single family home was up 5.4% from December, to $732,500, continuing a second month of increases off of November’s 12 month low of $650,000. Prices peaked in September when the median sales price was $820,000 with 75 homes sold. January sales were 44, a noticeable decrease from December’s 62 sales. It took a little longer for homes to close in January, as the days on market rose from 35 days to 46, however, as the number of new listings increased to 49, which keeps inventory about the same as the previous month (101 active listings). Looking back, inventory is unusually low even for the winter months. In January 2021 there were 176 active listings and January 2020 saw 394. Given such low inventory and strong buyer demand, Fairfield is still in a strong seller’s market with just 1.4 months of supply, the lowest level in several years. Buyers need houses to buy. Demand is strong and is expected to be so through the year. Interest rates experienced a steep increase recently, starting from the December 23rd dip at 3.11%, rising to 3.69% by February 10th for the 30 year fixed rate. Some predict the strong buyer demand to continue as many fear rates increasing further making homes unaffordable. The National Association of Realtors predict rates to reach close to 4% by years end, which in historical context, is still quite low. However with recent increases in home values, buyers budgets are being tested, and some are making offers at the upper level that they qualify for. For anyone considering a move, this is still a great time to sell a house in Fairfield. Do you know anyone looking for more information about their real estate market? I’d be happy to help.
12 Month Sales Activity

Housing Stats
(change from previous month)
| Median Sale Price: | $732,500 |
| change: | 5.40% |
| YTD change: | 0.00% |
| 12 month change: | 5.85% |
| Units Sold: | 44 |
| change: | -29.03% |
| Active Listings: | 101 |
| change: | 2.02% |
| New Listings: | 49 |
| change: | 40.00% |
| Days on Market: | 46 |
| change: | 31.43% |
| Months of Supply: | 1.40 (Seller's Market) |
| change: | 0.00% |
Interest Rates

Market Temperature
Local Real Estate Price Trends
| Dec-21 | Jan-22 | Change | |
| Bethel | $460,000 | $599,000 | 30.22% |
| Bridgeport | $305,000 | $310,000 | 1.64% |
| Brookfield | $580,000 | $409,300 | -29.43% |
| Danbury | $450,000 | $402,000 | -10.67% |
| Easton | $629,500 | $630,000 | 0.08% |
| Fairfield | $700,000 | $732,500 | 4.64% |
| Milford | $403,500 | $420,000 | 4.09% |
| Monroe | $450,000 | $530,250 | 17.83% |
| N. Haven | $507,000 | $475,000 | -6.31% |
| Newtown | $352,525 | $349,900 | -0.74% |
| Orange | $492,000 | $516,000 | 4.88% |
| Oxford | $440,000 | $534,500 | 21.48% |
| Redding | $658,500 | $697,500 | 5.92% |
| Ridgefield | $775,000 | $771,000 | -0.52% |
| Seymour | $275,000 | $256,630 | -6.68% |
| Shelton | $420,000 | $400,000 | -4.76% |
| Stratford | $335,000 | $339,500 | 1.34% |
| Trumbull | $525,000 | $501,500 | -4.48% |
| Weston | $1,088,000 | $1,250,000 | 14.89% |
| Westport | $1,650,000 | $2,200,000 | 33.33% |
Tips
Foods That Give Your Gut a Healthy Punch
Your gut plays an important role in your overall health and well-being. Here are some of the most gut-friendly foods and how they keep you healthy.
Whole grains have soluble fiber, which helps with digestion.
Pineapple has bromelain, an enzyme that helps break down food.
Bone broth contains a variety of minerals, including arginine, amino acids, collagen, and gelatin that can help to heal the lining of your gut.
Apple cider vinegar stimulates the production of digestive juices and stomach acid to improve digestion.
Asparagus contains an indigestible fiber called inulin, which feeds healthy bacteria.
Kimchi detoxifies the body with an infusion of fiber and antioxidants.
Ginger relaxes the stomach and helps relieve nausea.
Sauerkraut contains lots of fiber and good bacteria to help digestion.
Garlic includes vitamin B6, selenium, vitamin C, and manganese, all of which increase the production of good bacteria.
Onions support a strong immune system, boost insulin production and provide strong antioxidants.
Recipe
Pear and Goat Cheese Winter Salad

Ingredients
1 (5 oz.) pkg. mixed spring greens
1 pear, cored and sliced
1 cup glazed, candied pecans
1 (4 oz.) pkg. crumbled Goat cheese
2 Tbsp. balsamic vinegar
1½ Tbsp. pure maple syrup
1 Tbsp. olive oil
½ tsp. smooth Dijonmustard
Salt to taste
Directions
Place greens topped with pear slices in a large serving bowl. Sprinkle pecans and cheese on top. For dressing, whisk together vinegar, syrup, olive oil, mustard, and salt until well combined. Serve dressing on the side, or dress salad just before serving.
Real Estate Headlines
Fewer Homeowners Are Selling: The number of homes for sale is down 28.4% compared to a year ago, according to realtor.com® data. Two years ago, before the COVID-19 pandemic, the number of active listings was 60% higher than today.
Winter months tend to be slower for the housing market as fewer sellers list homes. But this winter, inventories have fallen more than normal. Economists downplay the effect of the pandemic, particularly the omicron variant, as the culprit. Instead, they say homeowners are hesitant to sell because they’re concerned about having to buy a new home themselves. That has prompted many to delay their selling plans, even as they watch the growing amount of equity in their properties. More than one in four potential sellers recently surveyed said they were choosing not to sell in the near term because they couldn’t find a home they wanted in their price range.
Over 40% of Homeowners Are Equity-Rich: Homeowners are continuing to see the values of their homes grow, leading to a rapid increase in the equity they hold in their properties. About 42% of mortgaged residential properties in the U.S. were considered equity-rich in the fourth quarter of 2021. In the fourth quarter of 2020, the percentage of equity-rich properties was 30.2%. The largest improvement in the share of equity-rich homes was across the Western and Southern states.
Rising Rents Add Pressure to Buy: Many renters are making moves toward homeownership as quickly rising mortgage rates and rents have them feeling increased pressure. Average monthly rents climbed more than 14% year over year in December 2021. Miami and Austin, Texas, have seen rents surge more than 30% over the past year. Some renters may find a mortgage payment, with still historically low interest rates that are under 4%, may cost them about the same as or less than their increased rent costs.
Buyers Rush to Lock In Rates: With mortgage rates are on the rise, buyers are watching them closely—and nervously. Their anxiety may be intensified by the rising costs of home prices. For these buyers, the peace of mind of a long rate lock may be worth the extra cost to hold that interest rate. Buyers are also looking at buying down their interest rate by paying points to get a more attractive rate. One discount point, in general, costs 1% of the total mortgage and could lower the interest rate by around 0.25%. Purchasing points could save tens of thousands and even hundreds of thousands of dollars over the life of a loan, lenders say, for buyers nervous about rising rates. NAR predicts the 30-year fixed-rate mortgage will rise this year and average 3.9% by the end of the year.
Competition Remains Unseasonably Strong: Homes are selling even faster than they were at this time last year as buyers continue to compete in the housing market. Housing inventories are lower as well, down 28% from a year ago. Seventy-nine percent of homes sold in December 2021 were on the market for less than a month, according to the National Association of REALTORS®. Properties typically remained on the market for just 19 days in December. As rents rise at a double-digit pace, renters are looking to homeownership for the safety net of a steady mortgage and hopes of long-term appreciation. Mortgage rates that remain under 4% are also an incentive. Housing indicators point to additional sellers entering the market this spring.
5 Kitchen Trends to Watch: According to Houzz.com’s 2022 Kitchen Trends Study, the following are the top 5 homeowners kitchen make over trends: 1. Quartz countertops dominate 2. Supersized kitchen islands 3. Vinyl flooring is a growing choice 4. White and gray are the top color choices 5. High-tech appliances.
Upcoming Events
A new year, all new events. Check out what’s going on throughout Connecticut.
Sales Trends: January
January Single-Family Home Sales
(OLP: original list price • LP: list price • SP: sale price • DOM: days on market)
| Address | Style | sq ft | BR | BA (f/h) | OLP | LP | SP | SP/OLP | DOM |
| 855 Bronson Rd | Colonial | 1,784 | 3 | 2/0 | $695,000 | $695,000 | $800,855 | 115% | 46 |
| 2780 Redding Rd | Colonial | 4,764 | 5 | 3/1 | $1,050,000 | $1,050,000 | $980,000 | 93% | 23 |
| 220 Springer Rd | Colonial | 2,552 | 4 | 2/1 | $1,095,000 | $1,095,000 | $1,200,000 | 110% | 40 |
| 4364 Black Rock Tpke | Colonial | 7,588 | 6 | 5/2 | $1,645,000 | $1,645,000 | $1,622,500 | 99% | 112 |
| 735 Redding Rd | Colonial, Farm House | 7,027 | 5 | 4/2 | $2,599,000 | $2,599,000 | $2,815,000 | 108% | 5 |
| 24 Melville Ave | Cape Cod | 2,003 | 3 | 2/0 | $500,000 | $500,000 | $500,000 | 100% | 63 |
| 253 Riverside Dr | Raised Ranch | 3,360 | 3 | 3/0 | $995,000 | $775,000 | $705,000 | 71% | 75 |
| 318 Collingwood Ave | Cape Cod | 3,492 | 4 | 3/1 | $850,000 | $799,900 | $760,000 | 89% | 90 |
| 635 Stillson Rd | Cape Cod | 1,338 | 3 | 2/1 | $699,000 | $659,000 | $649,000 | 93% | 121 |
| 658 Pequot Ave | Victorian | 5,781 | 4 | 4/2 | $3,450,000 | $2,795,000 | $2,520,000 | 73% | 127 |
| 640 Westport Tpke | Colonial | 2,474 | 3 | 2/1 | $599,000 | $599,000 | $570,000 | 95% | 33 |
| 20 Howard St | Cape Cod | 1,075 | 3 | 1/0 | $525,000 | $525,000 | $526,500 | 100% | 35 |
| 23 Eastfield Dr | Colonial | 3,730 | 5 | 4/1 | $884,000 | $789,000 | $802,150 | 91% | 87 |
| 1 Valley Ln | Colonial | 1,993 | 4 | 2/0 | $695,000 | $695,000 | $660,000 | 95% | 45 |
| 740 Mill Hill Ter | Colonial, Farm House | 2,800 | 4 | 4/0 | $1,199,000 | $1,199,000 | $1,200,000 | 100% | 76 |
| 145 Howard St | Colonial | 1,551 | 3 | 1/1 | $510,000 | $510,000 | $550,000 | 108% | 15 |
| 235 Figlar Ave | Cape Cod | 1,563 | 3 | 2/0 | $599,000 | $585,000 | $570,000 | 95% | 69 |
| 76 Oxford Rd | Colonial | 1,300 | 3 | 1/0 | $659,900 | $659,900 | $600,000 | 91% | 47 |
| 136 Arbor Dr | Cape Cod | 1,373 | 2 | 2/0 | $599,999 | $599,999 | $655,000 | 109% | 31 |
| 35 Knapps Hwy | Cape Cod | 1,930 | 3 | 2/0 | $459,500 | $459,500 | $445,000 | 97% | 67 |
| 4059 Park Ave | Cape Cod | 2,850 | 5 | 4/0 | $694,999 | $689,990 | $680,000 | 98% | 65 |
| 57 Oxbow Rd | Split Level | 2,691 | 4 | 2/1 | $849,000 | $849,000 | $925,000 | 109% | 19 |
| 860 Pequot Ave | Antique, Victorian | 6,896 | 6 | 5/1 | $3,999,999 | $3,899,999 | $3,700,000 | 93% | 187 |
| 100 Grace St | Cape Cod | 1,123 | 2 | 1/0 | $424,900 | $369,900 | $345,000 | 81% | 95 |
| 72 Lynnbrook Rd | Colonial | 1,445 | 2 | 1/1 | $425,000 | $425,000 | $420,000 | 99% | 28 |
| 2027 Hillside Rd | Antique | 2,848 | 3 | 3/0 | $995,000 | $995,000 | $1,051,000 | 106% | 33 |
| 195 Flintlock Rd | Colonial | 4,761 | 5 | 3/1 | $1,350,000 | $1,350,000 | $1,300,000 | 96% | 45 |
| 958 Hillside Rd | Antique | 4,276 | 4 | 4/1 | $1,998,000 | $1,649,000 | $1,700,000 | 85% | 140 |
| 26 Taylor Pl | Colonial | 1,607 | 3 | 2/1 | $659,000 | $659,000 | $650,000 | 99% | 34 |
| 92 Sherwood Dr | Ranch | 3,038 | 4 | 2/1 | $759,000 | $759,000 | $859,000 | 113% | 16 |
| 267 Penfield Rd | Colonial | 3,282 | 5 | 4/1 | $1,899,000 | $1,899,000 | $1,899,000 | 100% | 6 |
| 198 Old Blackrock Tpke | Ranch | 1,638 | 3 | 2/0 | $399,000 | $399,000 | $405,000 | 102% | 33 |
| 107 Bennett St | Ranch | 1,396 | 3 | 1/1 | $549,999 | $549,999 | $550,000 | 100% | 43 |
| 25 Quaker Ln | Cape Cod | 1,556 | 3 | 2/0 | $549,000 | $549,000 | $540,000 | 98% | 53 |
| 486 Morehouse Hwy | Cape Cod, Colonial | 1,509 | 4 | 1/1 | $499,900 | $499,900 | $545,000 | 109% | 11 |
| 212 Brookbend Rd | Colonial | 2,534 | 5 | 4/0 | $1,000,000 | $1,000,000 | $930,000 | 93% | 71 |
| 98 Fair Oak Dr | Split Level, Farm House | 2,656 | 4 | 2/1 | $1,075,000 | $1,075,000 | $1,075,000 | 100% | 39 |
| 197 Burr St | Cape Cod | 3,301 | 4 | 2/1 | $849,000 | $849,000 | $876,000 | 103% | 29 |
| 45 Glover St | Cape Cod | 1,718 | 4 | 1/1 | $820,000 | $820,000 | $782,000 | 95% | 11 |
| 392 Jefferson St | Ranch | 3,300 | 3 | 2/0 | $57,900 | $569,000 | $545,000 | 941% | 90 |
| 32 Woodside Ave | Cape Cod | 1,340 | 4 | 2/0 | $559,000 | $559,000 | $615,000 | 110% | 65 |
| 331 Riverside Dr | Colonial | 2,771 | 3 | 2/1 | $1,200,000 | $1,150,000 | $1,050,000 | 88% | 26 |
| 2145 Burr St | Contemporary | 4,124 | 4 | 4/1 | $1,925,000 | $1,839,900 | $1,798,000 | 93% | 105 |
| 26 Adelaide St | Colonial | 2,340 | 4 | 2/1 | $564,900 | $547,900 | $544,000 | 96% | 84 |
| Units Sold: 44 | $729,000 | $727,000 | $732,500 | 98% | 46 |
Are You Interested In A Real Estate Review?
“If you can’t fly, run; if you can’t run, walk; if you can’t walk, crawl; but by all means keep moving” -Martin Luther King, Jr.