Serving New Haven and Fairfield Counties | Contact: (203) 895-2783
Menu
Menu
Fairfield Market Report July 2021
Market Overview
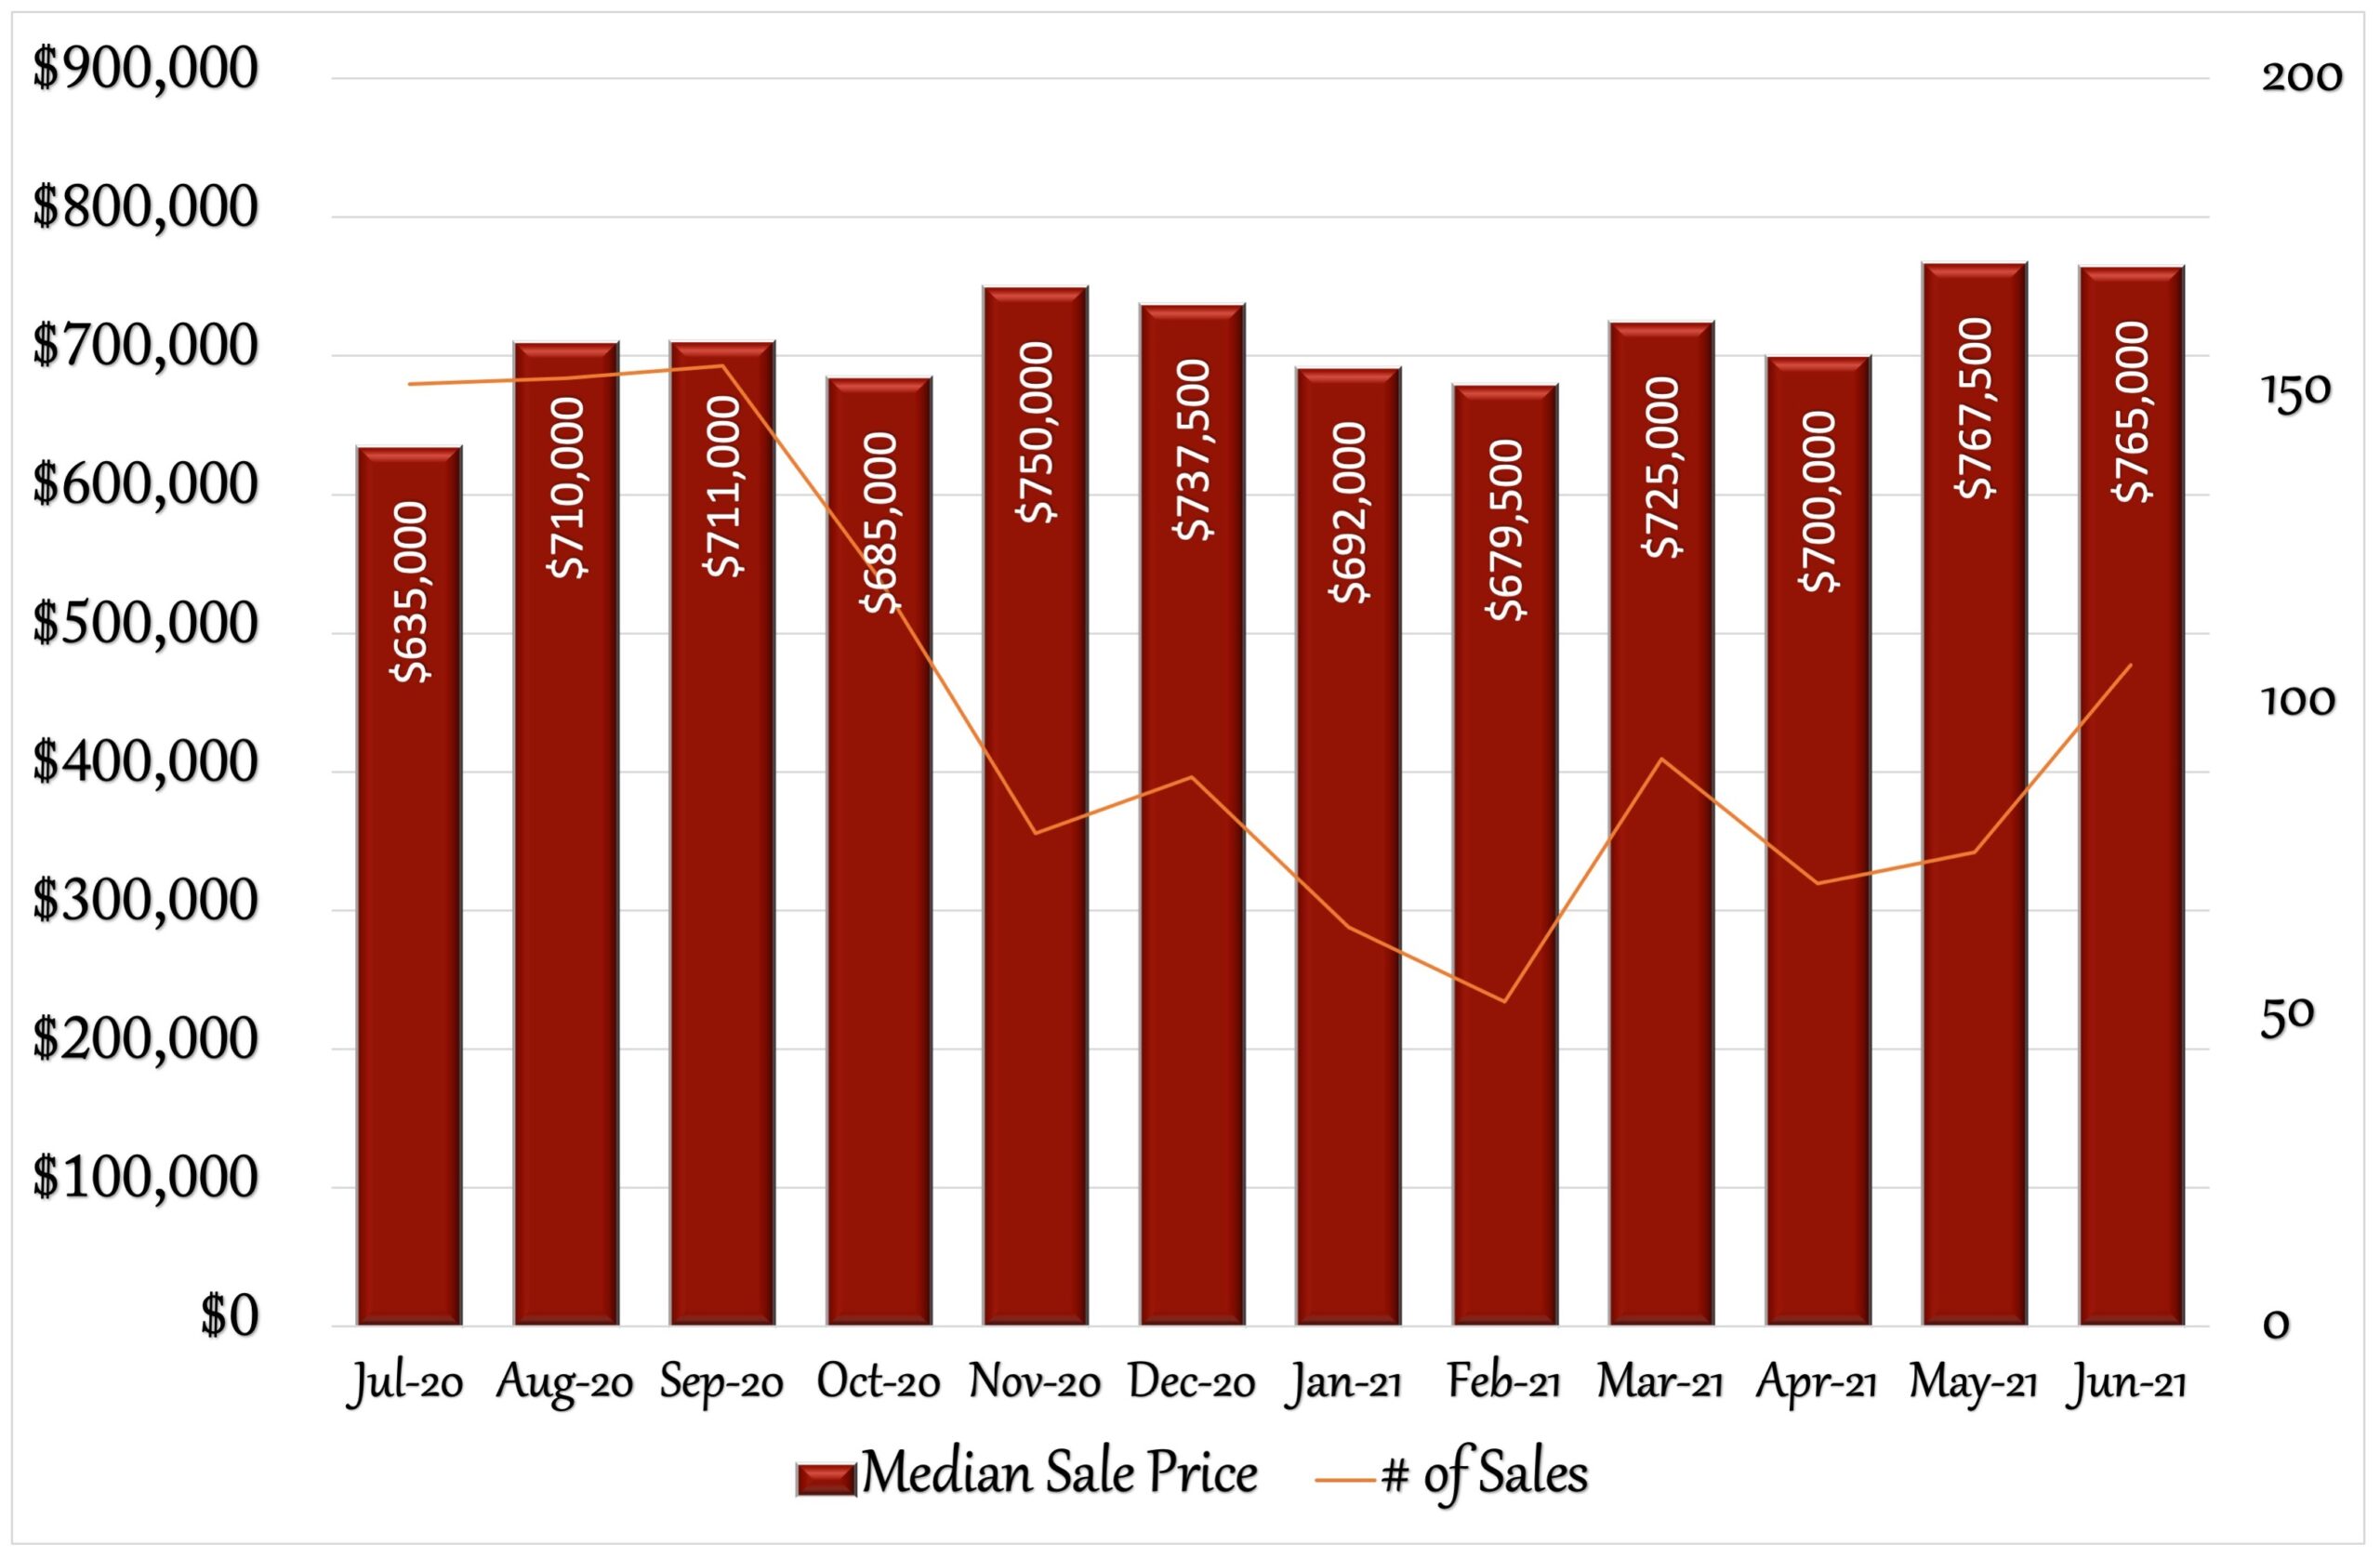
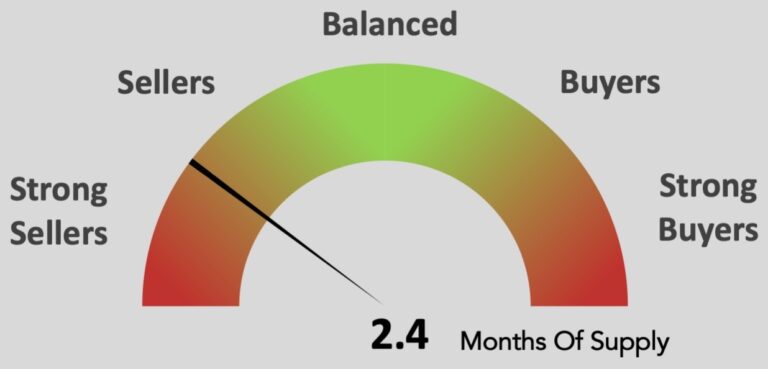
June continued to be another strong month for Fairfield’s real estate market. The median sales price for single family homes dropped slightly from $767,500 in May to $765,000 in June. That puts home prices up 10.55% for the year. Sales were strong, as more houses sold in June; 106 sales, compared to 76 and 71 sales the previous two months. Those houses sold much quicker as well, as the days on market dropped to a 3 year low at just 29 days. Buyer demand still remains high, as in most surrounding towns in Connecticut, due to low inventory. Sellers also received the prices they were asking, as the % of list price to sales price was again at 100%. And, with just 2.4 months of supply, Fairfield continues to be solidly in a seller’s market. Fewer sellers listed their homes, with 108 new listings in June. This has been a consistent trend all year, although new listings had been increasing in March, April and May. With interest rates still holding steady below 3%, buyers continue to want to move to Fairfield. The 30 year fixed rate was 2.98% by the end of the month. A 12% jump in pending sales to 100, July looks to be another strong month. For anyone considering a move, this is still a great time to sell a home in Fairfield. Do you know anyone looking for more information about their real estate market? I’d be happy to help.
12 Month Sales Activity
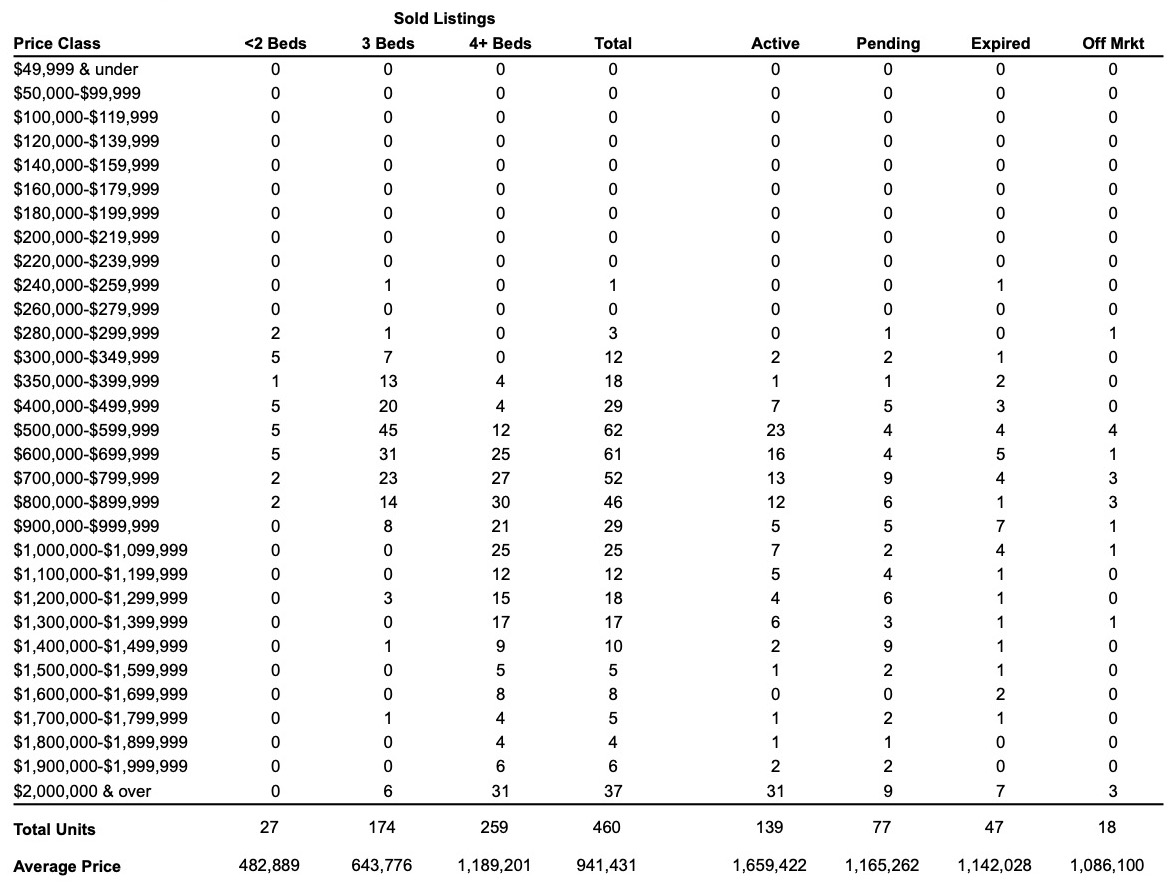
Housing Stats
(change from previous month)
| Median Sale Price: | $765,000 |
| change: | -0.33% |
| YTD change: | 10.55% |
| Units Sold: | 106 |
| change: | 39.47% |
| Active Listings: | 229 |
| change: | 0.44% |
| New Listings: | 108 |
| change: | -22.86% |
| Days on Market: | 29 |
| change: | -12.12% |
| Months of Supply: | 2.40 (Seller's Market) |
| change: | 0.00% |
Interest Rates

Market Temperature
Local Median Sales Price Trends
| May '21 | Jun '21 | Change | |
| Bethel | $390,000 | $515,000 | 32.05% |
| Bridgeport | $290,000 | $300,500 | 3.62% |
| Brookfield | $490,000 | $540,000 | 10.20% |
| Danbury | $410,000 | $447,500 | 9.15% |
| Easton | $852,000 | $889,450 | 4.40% |
| Fairfield | $767,500 | $765,000 | -0.33% |
| Milford | $428,000 | $432,500 | 1.05% |
| Monroe | $485,000 | $505,000 | 4.12% |
| Newtown | $540,000 | $572,500 | 6.02% |
| N. Haven | $350,000 | $342,500 | -2.14% |
| Orange | $470,000 | $461,500 | -1.81% |
| Oxford | $472,450 | $447,500 | -5.28% |
| Redding | $815,000 | $750,000 | -7.98% |
| Ridgefield | $722,500 | $757,500 | 4.84% |
| Seymour | $356,000 | $277,500 | -22.05% |
| Shelton | $463,750 | $419,900 | -9.46% |
| Stratford | $335,000 | $373,000 | 11.34% |
| Trumbull | $495,000 | $518,000 | 4.65% |
| Weston | $1,050,000 | $1,162,500 | 10.71% |
| Westport | $1,636,000 | $1,628,000 | -0.49% |
Tips
4 Reasons Downsizing Makes Sense
If you’re considering making a move to a smaller home, now may be a great time to list your property. Here’s why.
It’s a seller’s market. The real estate market is hot right now in most areas of the country. If you’ve been thinking about selling your current house and purchasing a smaller one, the timing is ideal to make your move.
Retirement is approaching. As you near retirement, it may make sense to reduce your monthly expenses and add those savings to your retirement nest egg. Downsizing your home means you’ll likely pay less in property taxes, insurance and mortgage payments.
Maintenance is reduced. A smaller home means less maintenance. If you have extra rooms you rarely use but still have to clean, heat and/or cool, it may be time to lessen the effort of maintaining a larger space.
You want to travel. If you’re hoping to spend more time visiting family or exploring the world, you’ll love the freedom of having less to take care of when you return home.
Remote Work: How To Hold Yourself Accountable
Working from home has its advantages, but it can also be filled with distractions. Try these tips to help you focus and hold yourself accountable when working remotely.
Set up a separate work space. Having a designated space for your home office can help you mentally separate your work and home life. Choose an area of your home that’s away from distractions such as kids, pets and household chores.
Establish tangible goals. Set daily, weekly and monthly goals for what you want to accomplish. Hold yourself accountable by writing down your tasks and crossing them off as you complete each one.
Follow a routine. Wake up at the same time each day and work a set number of hours. Try to complete work tasks during business hours and save personal and household tasks for when you’re off the clock.
Get dressed. While it can be tempting to stay in your pajamas all day, changing into “real clothes” sends a signal to your brain that it’s time to get to work.
Maintain communication. Check in regularly with your boss, coworkers and clients to ensure you’re supporting them with all necessary tasks. Follow up on in-progress projects and let everyone know if you have a change to your schedule or will be unavailable during a specific period of time.
Schedule your breaks. Instead of getting up from your desk any time a distraction pops up, schedule regular breaks by using a timer or calendar reminders. This can help you remain focused on the task in front of you while also allowing you time to eat lunch, take mental breaks or enjoy a quick walk.
Find an accountability partner. Find a coworker who is also working remotely, and share your routines, goals and to-do lists with each other. Check in periodically to see how you’re doing with following through on your intentions.
Real Estate Headlines
Housing Moving Past Pricing Peak, But Inventory Still Low: Nationwide, the rate of home price growth has started to slow, and the competition for homes may be showing some signs of easing somewhat. “The market’s topping out,” Mark Zandi, chief economist at Moody’s Analytics, told realtor.com®. It’s “starting to show cracks. It feels like we’ve hit the apex, and we’re moving to the other side of it.” But that doesn’t mean the housing market is heading for a bubble that is bound to burst. Mortgage lending has remained tight. Real estate economists have long said the current frenzy in the housing market is no housing bubble that is reminiscent of nearly a decade ago with the run-up in real estate. Some buyers are getting priced out of the market. There is also a severe shortage of homes for sale: Total housing inventory is down 42% year over year. Buyers still in the market may soon start to see less bidding wars and fewer offers that are way above the asking price. Regardless, economists are predicting an overall slowdown in prices and more moderation rather than any major downfall.
Plummeting Lumber Prices Little Help to Builders: The price of framing lumber has plunged about 50% over the last seven weeks, offering up a hopeful sign that skyrocketing building costs would ease. However, builders say that the prices they pay have only declined by a fraction of that percentage. The disconnect in pricing has always existed in the lumber supply chain. It can still be a “long lag time” before the full price reductions come to builders, the National Association of Home Builders reports. Meanwhile, new-home building prices for home buyers continue to rise. May’s price was 18% higher than last year.
The Home Improvement Boom Isn’t Letting Up Soon: Half of U.S. homeowners recently surveyed say they plan to spend more on home improvements in 2021 than they did last year. Many homeowners are using cash to complete these home renovation projects. kitchen and bathroom renovations tend to offer some of the highest returns on investment.
Top 7 Hot Spots for Undeveloped Land: Realtor.com® evaluated the 100 largest metros in the U.S. to find where land values have increased the most since the pandemic (comparing the first half of 2020 with the first half of 2021). The top 7 areas with % increase and price per sq. ft. of raw land are: North Port/Sarasota, FL (+92% / $2.52), Portland, OR (+72% / $9.17), Los Angeles, CA (+67% / $1.38), Boise City, ID (+52% / $3.06), Raleigh, NC. (+50% / $1.71), Syracuse, NY (+50% / $0.40), Spokane, WA (+47% / $0.43).
Upcoming Events
Connecticut’s event schedule is back this Summer, with outdoor concerts, plays, festivals, craft shows and more. So grab the family, hit the road and enjoy some of the area’s great fun filled events.
Sales Trends: January - June
June Single-Family Home Sales
(OLP: original list price • LP: list price • SP: sale price • DOM: days on market)
| Address | Style | sq ft | BR | BA (f/h) | OLP | LP | SP | SP/OLP | DOM |
| 34 New England Ave | Cape Cod, Bungalow | 750 | 2 | 1/0 | $250,000 | $250,000 | $300,000 | 120% | 6 |
| 274 Old Stratfield Rd | Cape Cod | 1,098 | 3 | 1/0 | $399,000 | $399,000 | $430,000 | 108% | 17 |
| 1030 Jennings Rd | Cape Cod | 1,613 | 3 | 2/0 | $549,900 | $549,900 | $549,900 | 100% | 21 |
| 1263 Brooklawn Ave | Colonial | 3,366 | 4 | 2/1 | $649,000 | $609,000 | $577,000 | 89% | 25 |
| 300 Godfrey Rd | Cape Cod | 1,703 | 3 | 2/0 | $599,000 | $599,000 | $661,000 | 110% | 54 |
| 1009 Powder Horn Ln | Colonial | 1,991 | 4 | 2/1 | $789,000 | $789,000 | $728,000 | 92% | 69 |
| 1236 Hulls Hwy | Colonial, Antique | 3,346 | 4 | 2/1 | $1,300,000 | $1,300,000 | $1,200,000 | 92% | 28 |
| 37 Patrick Dr | Colonial | 2,716 | 4 | 4/1 | $975,000 | $975,000 | $1,205,000 | 124% | 11 |
| 86 Judson Rd | Colonial | 3,137 | 3 | 3/1 | $1,599,900 | $1,599,900 | $1,650,000 | 103% | 15 |
| 155 Rose Hill Rd | Colonial, Antique | 4,526 | 5 | 4/1 | $2,485,000 | $2,485,000 | $2,400,000 | 97% | 21 |
| 64 Hamilton Ct | Colonial | 3,470 | 4 | 3/1 | $800,000 | $800,000 | $800,000 | 100% | 12 |
| 475 Algonquin Rd | Colonial | 5,493 | 5 | 4/1 | $1,450,000 | $1,450,000 | $1,450,000 | 100% | 17 |
| 69 Trail St | Colonial | 2,820 | 4 | 2/1 | $899,000 | $899,000 | $930,000 | 103% | 47 |
| 99 Eastlawn St | Colonial | 2,370 | 4 | 2/1 | $949,000 | $949,000 | $1,015,000 | 107% | 14 |
| 1345 Fence Row Dr | Contemporary | 5,464 | 4 | 3/2 | $1,500,000 | $1,396,000 | $1,260,000 | 84% | 241 |
| 787 Knapps Hwy | Ranch | 1,008 | 2 | 1/1 | $349,900 | $349,900 | $345,000 | 99% | 2 |
| 7 Pierce St | Colonial | 1,972 | 4 | 2/0 | $384,900 | $379,000 | $375,000 | 97% | 87 |
| 806 N. Benson Rd | Ranch | 1,320 | 2 | 2/0 | $559,000 | $559,000 | $601,000 | 108% | 16 |
| 44 Lockwood Rd | Cape Cod, Colonial | 3,042 | 5 | 3/1 | $699,000 | $699,000 | $780,000 | 112% | 68 |
| 130 Lakeview Dr | Colonial | 6,144 | 5 | 5/1 | $1,249,000 | $1,249,000 | $1,315,000 | 105% | 26 |
| 444 Pine Creek Ave | Colonial | 2,550 | 3 | 4/1 | $2,495,000 | $2,395,000 | $2,200,000 | 88% | 102 |
| 120 Argonne St | Ranch | 1,776 | 3 | 2/0 | $495,000 | $495,000 | $520,000 | 105% | 31 |
| 5797 Park Ave | Colonial | 2,310 | 3 | 3/0 | $529,000 | $529,000 | $650,000 | 123% | 22 |
| 420 Romanock Rd | Cape Cod | 1,901 | 3 | 3/0 | $750,000 | $719,000 | $725,000 | 97% | 67 |
| 139 Roseville St | Colonial | 2,181 | 3 | 3/1 | $550,000 | $550,000 | $545,000 | 99% | 277 |
| 1156 Oldfield Rd | Colonial | 1,555 | 4 | 1/1 | $640,000 | $640,000 | $690,000 | 108% | 22 |
| 261 Hemlock Hills Rd S. | Colonial | 4,776 | 4 | 3/2 | $969,000 | $969,000 | $945,000 | 98% | 41 |
| 377 Ruane St | Colonial | 3,200 | 4 | 2/1 | $1,299,000 | $1,299,000 | $1,300,000 | 100% | 22 |
| 1731 Bronson Rd | Colonial | 4,025 | 4 | 3/1 | $1,249,000 | $1,249,000 | $1,362,500 | 109% | 18 |
| 68 Prince St | Cape Cod, Colonial | 1,123 | 2 | 1/1 | $424,900 | $424,900 | $435,000 | 102% | 24 |
| 30 Boroskey Dr | Colonial | 1,791 | 3 | 2/0 | $649,000 | $649,000 | $650,000 | 100% | 62 |
| 55 Pepperbush Ln | Colonial | 2,780 | 4 | 3/1 | $959,000 | $959,000 | $952,400 | 99% | 66 |
| 24 High Meadow Rd | Cape Cod, Colonial | 3,131 | 5 | 3/1 | $1,200,000 | $1,158,000 | $1,158,000 | 97% | 31 |
| 71 Mona Ter | Colonial | 3,450 | 5 | 4/1 | $1,399,000 | $1,525,000 | $1,550,000 | 111% | 18 |
| 293 Andrassy Ave | Ranch | 2,052 | 3 | 2/0 | $549,900 | $549,900 | $581,000 | 106% | 11 |
| 40 Sedan Ter | Colonial | 1,699 | 3 | 1/1 | $545,000 | $545,000 | $630,000 | 116% | 33 |
| 40 Mayfair Rd | Raised Ranch | 2,720 | 3 | 2/1 | $659,900 | $649,900 | $642,500 | 97% | 77 |
| 1789 Fence Row Dr | Contemporary, Modern | 9,094 | 5 | 3/2 | $829,900 | $829,900 | $675,000 | 81% | 71 |
| 2486 Congress St | Cape Cod | 2,485 | 3 | 2/0 | $799,000 | $799,000 | $770,000 | 96% | 54 |
| 511 Riverside Dr | Cape Cod | 1,733 | 3 | 2/1 | $799,000 | $799,000 | $825,000 | 103% | 64 |
| 80 Potters Ln | Cape Cod, Colonial | 3,573 | 4 | 3/1 | $1,050,000 | $1,050,000 | $1,020,000 | 97% | 42 |
| 384 Rowland Rd | Colonial | 2,372 | 4 | 1/1 | $1,125,000 | $1,125,000 | $1,275,000 | 113% | 1 |
| 329 Jennings Rd | Ranch | 2,232 | 3 | 2/0 | $394,900 | $394,900 | $370,000 | 94% | 8 |
| 429 Lockwood Rd | Colonial | 2,308 | 3 | 2/0 | $443,000 | $443,000 | $443,000 | 100% | 0 |
| 473 High St | Cape Cod | 2,004 | 3 | 2/0 | $500,000 | $500,000 | $490,000 | 98% | 38 |
| 59 Warren Ave | Colonial | 1,827 | 3 | 2/0 | $520,000 | $520,000 | $520,000 | 100% | 32 |
| 43 Brookdale Rd | Colonial | 1,818 | 3 | 2/1 | $579,999 | $579,999 | $626,000 | 108% | 30 |
| 1241 Holland Hill Rd | Colonial | 1,960 | 4 | 3/1 | $649,000 | $649,000 | $660,000 | 102% | 19 |
| 175 Parkwood Rd | Colonial | 4,363 | 5 | 3/1 | $710,000 | $674,900 | $675,000 | 95% | 100 |
| 191 Doreen Dr | Ranch | 2,336 | 2 | 1/0 | $519,000 | $519,000 | $550,000 | 106% | 66 |
| 386 Valley Rd | Ranch | 3,610 | 3 | 2/1 | $700,000 | $700,000 | $740,000 | 106% | 11 |
| 128 Clinton St | Colonial | 1,975 | 3 | 2/0 | $849,000 | $799,000 | $799,000 | 94% | 59 |
| 1429 Mill Hill Rd | Colonial | 3,496 | 4 | 3/1 | $1,125,000 | $1,125,000 | $995,000 | 88% | 5 |
| 62 Round Hill Dr | Colonial, Split Level | 3,681 | 5 | 3/1 | $1,099,000 | $1,099,000 | $1,116,000 | 102% | 10 |
| 88 Stratfield Rd | Colonial, Tudor | 2,794 | 4 | 1/1 | $529,000 | $499,000 | $454,000 | 86% | 70 |
| 2445 Congress St | Cape Cod | 2,434 | 4 | 3/0 | $849,000 | $799,000 | $795,000 | 94% | 19 |
| 21 Ennis Ln | Colonial | 2,340 | 4 | 2/1 | $875,000 | $875,000 | $895,500 | 102% | 50 |
| 915 Old Post Rd | Colonial | 5,105 | 6 | 4/1 | $2,399,000 | $2,275,000 | $2,225,000 | 93% | 56 |
| 1462 N. Benson Rd | Ranch | 2,034 | 2 | 2/0 | $509,000 | $509,000 | $509,000 | 100% | 27 |
| 341 Crestwood Rd | Colonial | 3,797 | 5 | 4/1 | $799,000 | $799,000 | $750,000 | 94% | 18 |
| 95 Greenleigh Rd | Colonial | 3,384 | 5 | 4/2 | $985,000 | $985,000 | $975,000 | 99% | 27 |
| 21 Daybreak Rd | Colonial | 4,112 | 4 | 2/1 | $1,139,000 | $1,139,000 | $1,346,000 | 118% | 18 |
| 1 Hubbell Ln | Colonial, Other | 10,824 | 7 | 6/2 | $3,499,000 | $3,499,000 | $3,300,000 | 94% | 26 |
| 342 Warde Ter | Raised Ranch | 2,146 | 4 | 3/0 | $699,000 | $699,000 | $680,000 | 97% | 37 |
| 310 Taintor Dr | Colonial | 2,360 | 4 | 2/1 | $1,400,000 | $1,400,000 | $1,298,500 | 93% | 37 |
| 114 Hillcrest Rd | Cape Cod | 1,594 | 3 | 2/0 | $525,000 | $525,000 | $525,000 | 100% | 12 |
| 170 Rolling Hills Dr | Colonial | 3,483 | 4 | 2/2 | $719,000 | $719,000 | $730,000 | 102% | 49 |
| 286 Palamar Dr | Cape Cod, Colonial | 2,249 | 4 | 2/0 | $725,000 | $725,000 | $731,250 | 101% | 58 |
| 4375 Congress St | Colonial, Antique | 3,665 | 4 | 2/1 | $1,149,000 | $1,149,000 | $1,187,000 | 103% | 34 |
| 361 Brookbend Rd | Colonial | 5,370 | 4 | 3/2 | $1,750,000 | $1,750,000 | $1,655,000 | 95% | 108 |
| 75 Harvester Rd | Cape Cod | 1,840 | 3 | 2/0 | $510,000 | $510,000 | $510,000 | 100% | 29 |
| 32 Fleming Ln | Ranch, Cottage | 1,718 | 2 | 3/0 | $729,000 | $729,000 | $800,000 | 110% | 14 |
| 680 Stillson Rd | Colonial | 3,750 | 4 | 3/1 | $999,000 | $999,000 | $1,017,000 | 102% | 25 |
| 70 Hersh Rd | Colonial | 3,430 | 4 | 2/1 | $1,075,000 | $1,075,000 | $1,100,000 | 102% | 28 |
| 70 Meadow Ridge Rd | Colonial | 5,570 | 5 | 4/1 | $1,799,000 | $1,799,000 | $2,010,000 | 112% | 142 |
| 637 High St | Cape Cod | 1,369 | 4 | 2/0 | $525,000 | $525,000 | $525,000 | 100% | 0 |
| 162 Papermill Ln | Colonial | 3,028 | 4 | 2/1 | $815,000 | $815,000 | $835,000 | 102% | 44 |
| 956 Oldfield Rd | Cape Cod | 2,132 | 3 | 2/1 | $999,000 | $949,000 | $945,000 | 95% | 59 |
| 171 Fulling Mill Ln | Contemporary | 5,251 | 4 | 3/2 | $1,350,000 | $1,350,000 | $1,532,000 | 113% | 5 |
| 352 Melville Ave | Split Level | 1,411 | 3 | 1/1 | $420,000 | $420,000 | $425,000 | 101% | 6 |
| 250 Colonese Rd | Ranch | 1,144 | 3 | 1/0 | $464,950 | $464,950 | $458,000 | 99% | 46 |
| 201 Edgewood Rd | Colonial | 2,806 | 4 | 2/0 | $649,000 | $629,000 | $629,000 | 97% | 73 |
| 461 S. Pine Creek Rd | Cape Cod | 1,400 | 3 | 2/0 | $695,000 | $695,000 | $750,000 | 108% | 32 |
| 244 N. Pine Creek Rd | Colonial, Farm House | 2,640 | 4 | 3/1 | $814,900 | $814,900 | $836,000 | 103% | 15 |
| 1368 Burr St | Colonial, Cottage | 5,455 | 6 | 5/1 | $2,395,000 | $2,395,000 | $2,395,000 | 100% | 36 |
| 38 Beaumont St | Colonial | 1,176 | 2 | 1/1 | $525,000 | $525,000 | $550,000 | 105% | 3 |
| 200 Longdean Rd | Colonial | 2,134 | 4 | 2/1 | $625,000 | $625,000 | $627,100 | 100% | 19 |
| 143 Hulls Hwy | Cape Cod | 1,997 | 3 | 3/0 | $729,000 | $729,000 | $705,000 | 97% | 63 |
| 234 Catherine Ter | Colonial | 1,982 | 3 | 1/1 | $799,000 | $799,000 | $850,000 | 106% | 12 |
| 99 Burrwood Cmn | Colonial | 6,584 | 5 | 4/1 | $1,890,000 | $1,890,000 | $1,890,000 | 100% | 12 |
| 427 Fairfield Woods Rd | Cape Cod | 2,236 | 4 | 2/0 | $549,000 | $549,000 | $595,000 | 108% | 10 |
| 32 Lookout Dr S. | Colonial | 3,868 | 5 | 3/2 | $1,148,000 | $1,148,000 | $1,225,000 | 107% | 25 |
| 965 Old Post Rd | Colonial | 6,665 | 6 | 5/1 | $1,895,000 | $1,895,000 | $1,895,000 | 100% | 148 |
| 211 Church Hill Rd | Colonial | 1,999 | 3 | 1/1 | $489,000 | $465,000 | $465,000 | 95% | 147 |
| 231 Henderson Rd | Colonial | 1,650 | 3 | 1/1 | $509,000 | $509,000 | $500,000 | 98% | 16 |
| 41 Alma Dr | Raised Ranch | 2,000 | 3 | 2/1 | $600,000 | $600,000 | $646,000 | 108% | 14 |
| 195 Ross Hill Rd | Colonial | 1,876 | 3 | 1/1 | $600,000 | $600,000 | $700,000 | 117% | 6 |
| 526 Beach Rd | Ranch | 1,670 | 4 | 2/1 | $825,000 | $825,000 | $825,000 | 100% | 69 |
| 118 French St | Colonial | 2,265 | 4 | 3/1 | $1,249,000 | $1,249,000 | $1,300,000 | 104% | 8 |
| 390 Harbor Rd | Colonial, Antique | 4,942 | 5 | 4/1 | $3,500,000 | $3,000,000 | $3,000,000 | 86% | 572 |
| 86 Moody Ave | Colonial | 2,222 | 5 | 2/0 | $569,000 | $569,000 | $559,000 | 98% | 30 |
| 122 Stratfield Rd | Colonial, Victorian | 2,749 | 3 | 3/0 | $649,000 | $649,000 | $634,000 | 98% | 140 |
| 83 Buena Vista Rd | Colonial | 1,892 | 3 | 2/0 | $680,000 | $680,000 | $760,000 | 112% | 6 |
| 423 Lucille St | Colonial | 3,570 | 4 | 5/0 | $874,900 | $839,900 | $792,000 | 91% | 123 |
| 499 Hemlock Rd | Colonial | 3,656 | 6 | 3/1 | $1,250,000 | $1,250,000 | $1,100,000 | 88% | 50 |
| 1510 Fairfield Beach Rd | Colonial | 3,150 | 4 | 4/0 | $1,999,999 | $1,899,999 | $1,815,000 | 91% | 208 |
| Units Sold: 106 | $794,000 | $794,000 | $765,000 | 100% | 29 |
Are You Interested In A Real Estate Review?