
Serving New Haven and Fairfield Counties | Contact: (203) 895-2783
Menu
Menu
Fairfield Market Report June 2023
Market Overview
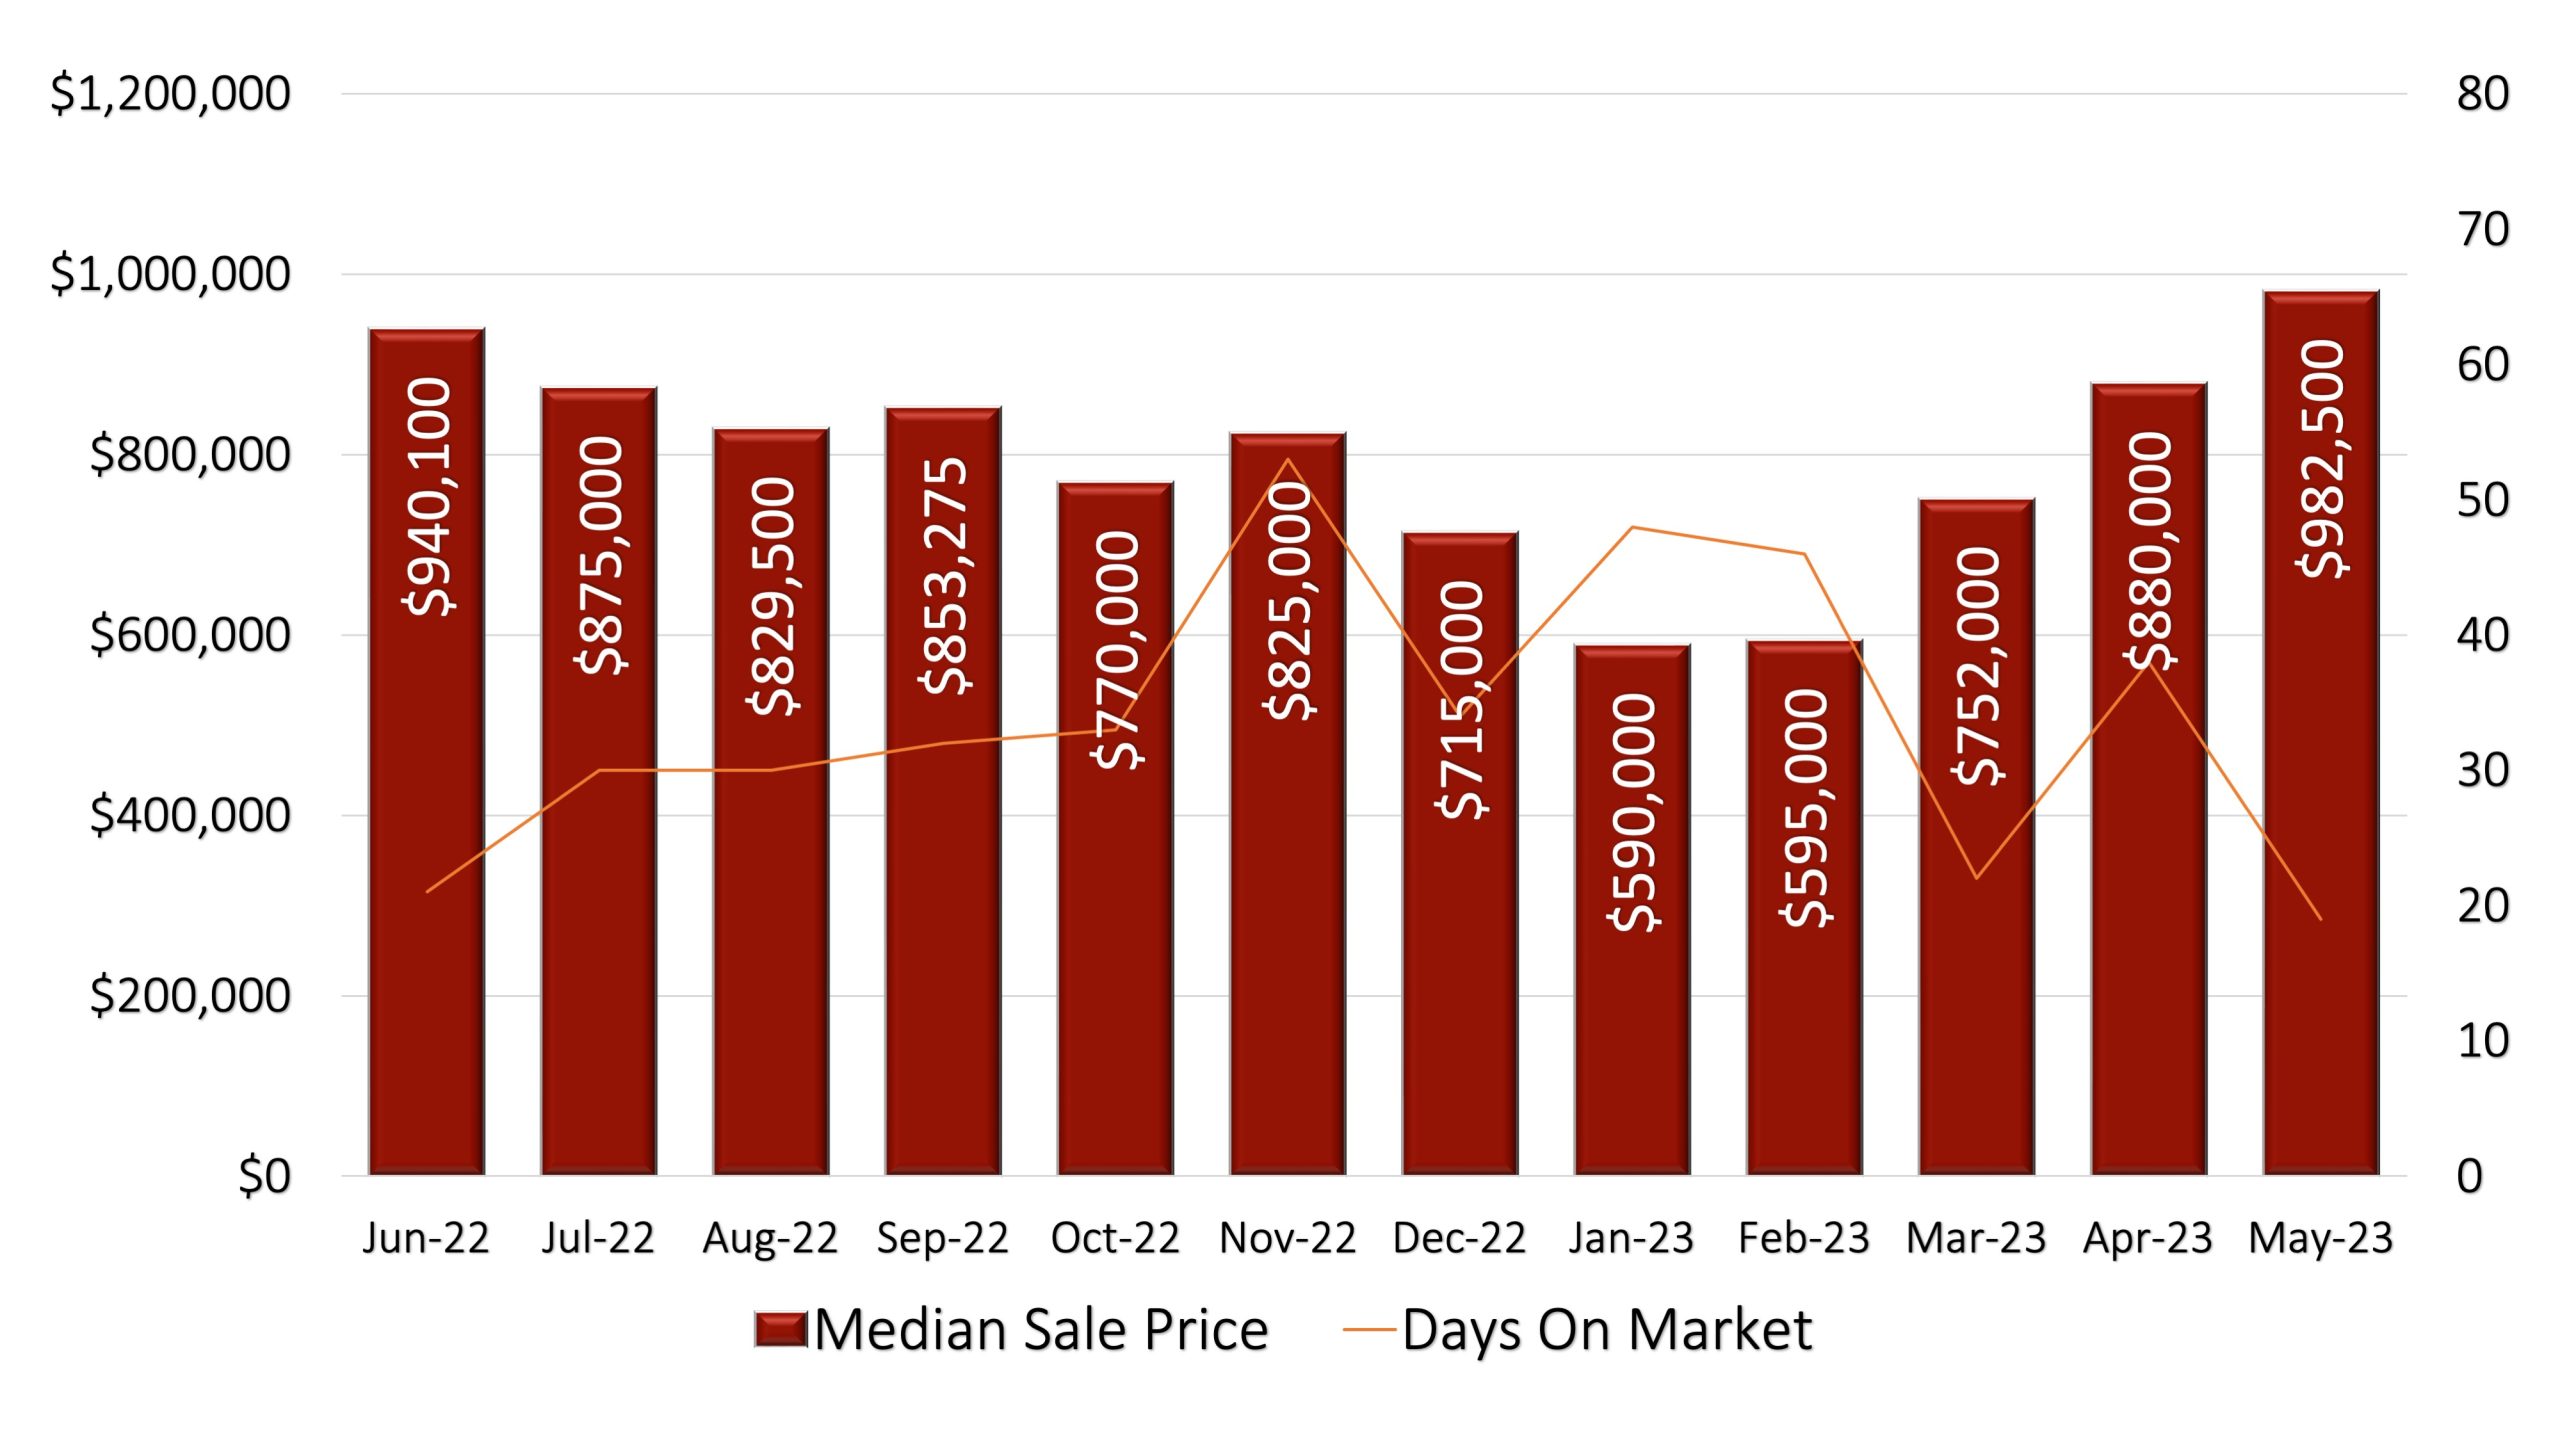
The Spring real estate market has been strong in Fairfield, as May continued a 4th straight month increase in the Median sales price for single-family homes. Home values started the year off low at $590,000, which ended several months of decline in the Fall. Since then, home values have risen over 66% to $982,000 ending May, with 44 homes sold. That’s an all-time record in Fairfield, surpassing the previous high reached in June, 2022 when the median sales price topped $940,000. Sellers may be noticing the rising home values as Inventory increased as well in May, to 146 homes on the market, compared to 122 in April and 98 in March. Inventory increases are good overall, as even with higher interest rates and higher home prices, buyers are not lacking this Spring. They are taking homes quickly. Days on market was only 19 in May. Compare that to the winter when days on market was 46 and 48 days. May homes sold on average close to 102% above list price. An increase over the past several months when homes were selling at between 96% and 100% of list price. Many real estate experts believe that buyers have been adjusting to the higher interest rates hovering in the mid to upper 6% range. Positive economic forecasts such as a steady decrease in the inflation rate to around 4% annually (down from 7%), strong jobs numbers and a debt ceiling default crisis averted in Congress have given confidence to home buyers that higher prices are here to stay. Many see the continued low inventory numbers as an annoying part of their difficult real estate search and are willing to pay the higher prices that the market bears. For several years, Fairfield, and much of Fairfield County, has been in a strong sellers-market. Not since July of 2020 have we seen a balanced market between buyers and sellers, when months of supply was 6. That marked a big shift, as the preceding 2-3 years had favored Fairfield buyers. Current months of supply is just 2.8, favoring sellers. For anyone considering a move, this is a great time to sell in Fairfield. Do you know anyone looking for more information about their real estate market? I’d be happy to help.
12 Month Sales Activity
Housing Stats
(change from previous month)
| Current Month | Previous Month | 12 month ago | |
| Median Sale Price: | $982,500 | $880,000 | $750,000 |
| change: | 11.65% | 31.00% | |
| YTD change: | 66.53% | ||
| Units Sold: | 44 | 52 | 57 |
| change: | -15.38% | -22.81% | |
| Active Listings: | 146 | 122 | 197 |
| change: | 19.67% | -25.89% | |
| New Listings: | 104 | 85 | 138 |
| change: | 22.35% | -24.64% | |
| Days on Market: | 19 | 38 | 19 |
| change: | -50.00% | 0.00% | |
| Months of Supply: | 2.8 | 2.3 | 3.1 |
| change: | 21.74% | -9.68% |
interest Rates
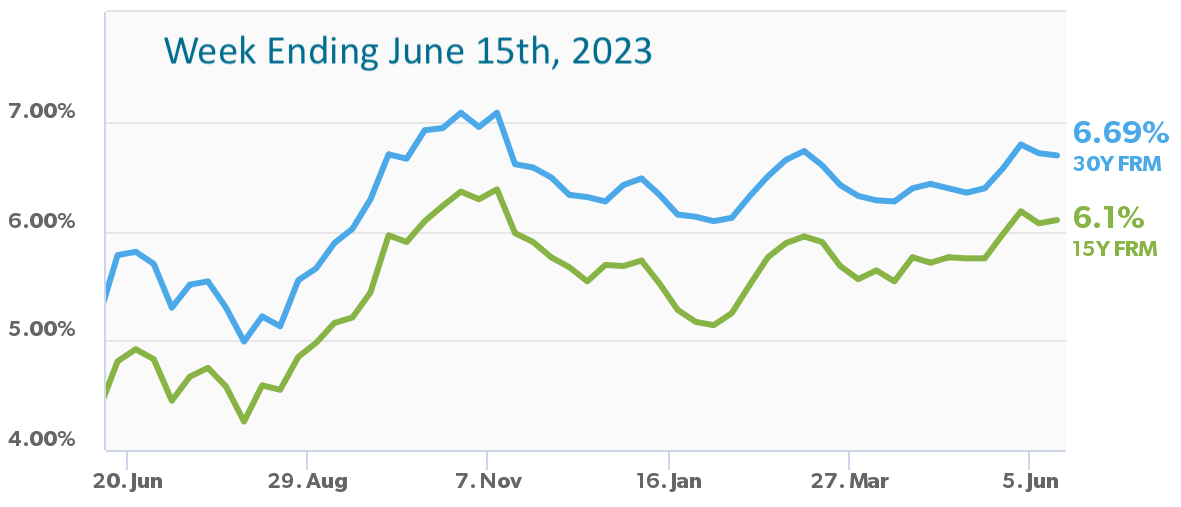
Mortgage rates are down following an increase of more than half a percent over five consecutive weeks. Turbulence in the financial markets is putting significant downward pressure on rates, which should benefit borrowers in the short-term. During times of high mortgage rate volatility, homebuyers would greatly benefit from shopping for additional rate quotes.
Absorption Rate
The Absorption Rate, also know as Months Of Supply, is a great measure of the current market conditions. It indicates the number of months it would take the current number of houses on the market to sell if no additional houses came on the market. A months of supply under 4 is considered a seller’s market. Between 4 – 6 months would be a balanced market while over 6 months is considered a buyer’s market.

Local Real Estate Price Trends
| Curent Month | Previous Month | Change | |
| Bethel | $548,000 | $510,000 | 7.45% |
| Bridgeport | $315,000 | $340,000 | -7.35% |
| Brookfield | $566,000 | $480,000 | 17.92% |
| Danbury | $425,000 | $437,500 | -2.86% |
| Easton | $1,087,500 | $936,250 | 16.15% |
| Fairfield | $982,500 | $880,000 | 11.65% |
| Milford | $430,000 | $508,000 | -15.35% |
| Monroe | $545,000 | $600,000 | -9.17% |
| Newtown | $590,000 | $581,000 | 1.55% |
| North Haven | $450,500 | $381,100 | 18.21% |
| Orange | $564,000 | $523,000 | 7.84% |
| Oxford | $610,000 | $410,000 | 48.78% |
| Redding | $890,000 | $830,000 | 7.23% |
| Ridgefield | $1,194,500 | $1,075,000 | 11.12% |
| Seymour | $341,500 | $430,250 | -20.63% |
| Shelton | $421,000 | $550,000 | -23.45% |
| Stratford | $380,000 | $379,426 | 0.15% |
| Trumbull | $577,500 | $538,750 | 7.19% |
| Weston | $1,090,000 | $1,295,000 | -15.83% |
| Westport | $2,600,000 | $2,400,000 | 8.33% |
Home Sales
| Address | Style | sq ft | BR | BA (f/h) | OLP | LP | SP | SP/OLP | DOM |
| 60 Sedan Ter | Colonial | 2,126 | 3 | 1/1 | $649,900 | $649,900 | $615,000 | 95% | 22 |
| 3250 North St | Colonial | 2,320 | 4 | 2/1 | $749,900 | $749,900 | $749,900 | 100% | 153 |
| 60 Knollwood Dr | Ranch | 2,544 | 3 | 3/0 | $675,000 | $675,000 | $827,000 | 123% | 52 |
| 113 Charles St | Colonial | 1,348 | 3 | 2/1 | $849,000 | $849,000 | $930,000 | 110% | 15 |
| 283 Mill Hill Rd | Colonial | 3,779 | 4 | 3/1 | $1,525,000 | $1,525,000 | $1,525,000 | 100% | 11 |
| 191 Main St | Colonial, Antique | 2,794 | 3 | 3/0 | $2,300,000 | $2,300,000 | $2,500,000 | 109% | 9 |
| 780 Tunxis Hill Rd | Ranch | 1,976 | 3 | 2/0 | $535,000 | $535,000 | $550,000 | 103% | 22 |
| 315 Country Rd | Half Duplex | 2,128 | 3 | 2/1 | $759,000 | $759,000 | $740,000 | 97% | 17 |
| 311 Harvester Rd | Ranch | 1,308 | 3 | 1/0 | $495,900 | $495,900 | $647,000 | 130% | 12 |
| 1039 S. Pine Creek Rd | Cape Cod, Cottage | 1,914 | 4 | 3/0 | $950,000 | $950,000 | $975,000 | 103% | 6 |
| 71 Richard Pl | Split Level | 3,136 | 4 | 3/1 | $975,000 | $975,000 | $990,000 | 102% | 12 |
| 840 Mill Hill Rd | Farm House, Victorian | 4,097 | 4 | 3/0 | $1,495,000 | $1,495,000 | $1,804,000 | 121% | 8 |
| 62 Browns Ln | Ranch | 1,723 | 3 | 2/0 | $625,000 | $625,000 | $641,000 | 103% | 17 |
| 1568 Burr St | Ranch | 3,542 | 3 | 2/1 | $849,900 | $750,000 | $740,000 | 87% | 62 |
| 107 Autumn Ridge Rd | Colonial, Split Level | 3,306 | 4 | 3/1 | $849,000 | $849,000 | $939,000 | 111% | 18 |
| 88 Camden St | Colonial | 2,166 | 4 | 2/1 | $559,000 | $549,900 | $549,900 | 98% | 98 |
| 194 Eastlawn St | Cape Cod | 1,186 | 2 | 2/0 | $700,000 | $700,000 | $885,000 | 126% | 11 |
| 111 Sturges Rd | Colonial | 2,589 | 4 | 2/1 | $1,195,000 | $1,195,000 | $1,200,000 | 100% | 46 |
| 971 Fairfield Beach Rd | Cape Cod, Colonial | 2,939 | 3 | 4/1 | $3,050,000 | $2,599,000 | $2,524,253 | 83% | 247 |
| 126 James St | Cape Cod | 1,501 | 3 | 2/0 | $685,000 | $685,000 | $791,000 | 115% | 15 |
| 245 Rowland Rd | Colonial | 3,753 | 5 | 4/1 | $2,499,000 | $2,499,000 | $2,450,000 | 98% | 16 |
| 1660 Black Rock Tpke | Cape Cod | 1,438 | 3 | 1/1 | $399,900 | $399,900 | $420,000 | 105% | 16 |
| 123 Judd St | Colonial | 3,325 | 4 | 2/1 | $1,199,000 | $1,099,000 | $1,050,000 | 88% | 82 |
| 492 Ruane St | Colonial, Farm House | 3,805 | 5 | 4/1 | $1,599,000 | $1,599,000 | $1,620,000 | 101% | 61 |
| 149 Woodside Cir | Contemporary, Split Level | 1,944 | 3 | 2/1 | $649,500 | $649,500 | $727,000 | 112% | 21 |
| 88 Milton St | Cape Cod, Colonial | 2,001 | 4 | 2/0 | $899,900 | $899,900 | $925,000 | 103% | 54 |
| 34 Plum St | Colonial | 1,300 | 3 | 1/1 | $489,000 | $445,000 | $445,000 | 91% | 72 |
| 2800 Black Rock Tpke | Cape Cod | 1,786 | 4 | 2/0 | $449,000 | $449,000 | $501,000 | 112% | 12 |
| 30 Robert Ct | Ranch | 1,176 | 3 | 1/0 | $449,000 | $449,000 | $612,750 | 136% | 6 |
| 738 Beach Rd | Cape Cod | 1,980 | 3 | 2/1 | $950,000 | $950,000 | $1,100,000 | 116% | 33 |
| 257 Blue Bell Ln | Colonial | 3,162 | 4 | 3/1 | $1,250,000 | $1,250,000 | $1,200,000 | 96% | 8 |
| 645 Hillside Rd | Colonial | 5,950 | 5 | 4/1 | $2,299,900 | $2,299,900 | $2,299,900 | 100% | 75 |
| 561 Oldfield Rd, Unit #561 | Colonial | 2,736 | 4 | 3/1 | $1,199,000 | $1,199,000 | $1,203,000 | 100% | 19 |
| 90 S. Pine Creek Rd | Colonial | 2,918 | 4 | 2/1 | $999,000 | $999,000 | $1,245,000 | 125% | 13 |
| 944 Pequot Ave | Colonial, Antique | 4,307 | 6 | 5/1 | $2,900,000 | $2,900,000 | $2,900,000 | 100% | 65 |
| 855 Stillson Rd | Colonial, Farm House | 4,146 | 5 | 4/1 | $1,599,000 | $1,599,000 | $1,635,000 | 102% | 18 |
| 118 Mill River Rd | Colonial | 2,252 | 4 | 1/1 | $599,000 | $599,000 | $675,000 | 113% | 11 |
| 1394 Mill Plain Rd | Colonial, Farm House | 3,592 | 3 | 2/1 | $1,195,000 | $1,195,000 | $1,050,000 | 88% | 168 |
| 404 Castle Ave | Colonial | 2,500 | 4 | 2/1 | $799,900 | $799,900 | $795,000 | 99% | 122 |
| 1066 Merwins Ln | Colonial | 7,732 | 5 | 4/2 | $2,150,000 | $2,150,000 | $2,100,000 | 98% | 13 |
| 408 Winnepoge Dr | Colonial | 3,119 | 4 | 3/0 | $1,025,000 | $1,025,000 | $1,150,000 | 112% | 12 |
| 274 Rolling Hills Dr | Colonial | 4,927 | 4 | 3/1 | $1,275,000 | $1,275,000 | $1,336,000 | 105% | 38 |
| 733 Rowland Rd | Cape Cod | 1,333 | 4 | 1/1 | $1,299,000 | $1,249,000 | $1,240,000 | 95% | 52 |
| 440 Barlow Rd | Colonial | 4,612 | 5 | 3/1 | $1,895,000 | $1,895,000 | $1,815,000 | 96% | 53 |
| Units Sold: 44 | $950,000 | $950,000 | $982,500 | 102% | 19 |
National Real Estate Headlines
Mortgage Rates Again Near 7%: The 30-year fixed-rate mortgage rose to 6.79% in the first days of June, forcing more home buyers to recalculate their budget. Mortgage applications for home purchases are falling—down 31% year over year, according to the Mortgage Bankers Association. But economists say mortgage rates are likely to drop in upcoming weeks, which could help alleviate some of the affordability pressure on home buyers. In fact, by June 15th, they were down to 6.69%. At rates approaching 7%, nearly 5.5 million more households are priced out of the housing market than a year ago. Though even with fewer buyers, more than one-third of properties are sold above list price due to limited inventory. NAR has been predicting rates to stabilize near 6% in the second half of the year.
What Fed’s Pause On Rate Hikes Means For Home Buyers: Ending a cycle of 15 months of rate hikes, the Federal Reserve voted this week to hold off on another increase to its key short-term interest rate. The news fueled hopes that borrowing costs for home buyers could cool in the coming weeks, but only if the Fed continues to pause rate hikes. Mortgage rates are not directly tied to the Fed’s benchmark rate but are often influenced by it. They are more closely tied to the 10-year Treasury bond, which responded this week to better inflation news with a rate decline to 3.7%. When combined with the decline in the inflation rate to about 4% in May, many predict lower mortgage rates to follow.
Middle-Income Buyers Suffer Most In Housing Shortage: The national housing shortage is most acute in price points that middle-income buyers can afford, according to new National Association of REALTORS® data. The market is short about 320,000 listings worth up to $256,000—which is considered the affordability range for households earning up to $75,000 annually, according to the Housing Affordability & Supply Report. Due to the pronounced inventory squeeze in these price points, middle-income buyers may find the steepest competition when shopping for homes. And as a result, these buyers may find it even harder to build wealth through homeownership. Middle-income buyers overall can afford to purchase less than a quarter—or 23%—of listings nationwide, the report shows. Five years ago, middle-income buyers could afford half of all homes on the market.
Boomers And Millennials Fight For Homes As Housing Market Cools: Prices have cooled in the once red-hot housing market, but competition is heating up between two generations in seemingly perpetual conflict. Millennials entering their prime homebuying years and baby boomers are vying for the same homes. But most boomers have a key advantage: substantial equity from previous home purchases and higher incomes, which help them avoid the growing costs of a long-term mortgage. Buyers in the baby boomer generation were largely repeat buyers last year, meaning they already had equity from previous homes to boost their purchasing power. Half of Older Boomers and one-third of Younger Boomers paid all cash allowing them to more easily make housing trades and win any multiple-bid situations.
Home Features Young Buyers Care About: First-time homebuyers, consisting of elder and younger millennials and Gen-Z generations make up about 1/4 of the home-buying market. This younger generation of home buyers have specific features from the homes they seek. Smart Home Technology, such as thermostats, doorbells, cameras and keyless entries are a top priority. Livable Outdoor Spaces, such as gardens, backyards and outdoor cooking areas are in high demand. Home Offices have significant appeal to young buyers. Spacious Bathrooms are in high demand, especially as rising home cost force some buyers to settle for smaller living spaces. Luxurious Laundry Rooms with high-quality washer/dryers, built-in storage and counter space. Ample Storage Areas or dedicated on-site storage unit, well organized with shelving and space.
Tips
FUN & FRUGAL VACATION DESTINATIONS
If you’re willing to be flexible and creative, you can plan an unforgettable international trip on a reasonable budget. Prior to selecting your destination, be sure to check for any travel advisories on the U.S. State Department website: Travel.State.gov.
Thailand is a great place to backpack in Southeast Asia. If you’re on a tight budget, it’s possible to get by on $30 per day thanks to dormitories, street vendors, public transportation, and other inexpensive and free attractions. If you prefer more private accommodations, expect to spend at least $60 per day.
Visit Central America to trek through jungles, surf incredible waves and roam ancient ruins without the tourist crowds you’d find in the Caribbean. Be sure to sample plenty of delicious and inexpensive local cuisine. In El Salvador, Honduras, Nicaragua, and Guatemala, private hostel rooms can be found for $15–$30 per night.
If you’re looking for an affordable, off-the-radar region, try The Balkans in southeastern Europe. Experience adventurous hikes along glacial mountain lakes, breathtaking coastal views and exciting nightlife. Accommodations are reasonable at about $45–$55 per night for a private vacation rental apartment.
Explore stunning landscapes and cultural richness throughout Africa. Enjoy safaris, historic attractions and exquisite cuisine. You can travel in Tunisia, Morocco or Kenya for about $80 per day.
India has rich cultural history and regional diversity, along with welcoming communities and mouthwatering food. If you stick to local fare, you can savor three hearty meals for just $10 per day. Visit the Taj Mahal — one of the Seven Wonders of the World — for about $15.
Food
SUMMER VEGETABLE SALAD WITH CREAMY VINAIGRETTE

Serves 4
Ingredients:
1 medium cucumber
1 medium zucchini
1 pint cherry tomatoes
¼ cup fresh parsley
¼ cup fresh basil
¼ cup fresh mint
2 Tbsp. fresh chives
Vinaigrette:
¼ cup mayonnaise
1 Tbsp. lemon juice
2 Tbsp. apple cider vinegar
½ tsp. salt
¼ tsp. black pepper
Directions:
Dice cucumber and zucchini, and halve tomatoes. Finely chop parsley, basil, mint, and chives.
Whisk all vinaigrette ingredients together in a large bowl. Add vegetables and herbs to bowl, and gently toss to combine. Refrigerate until ready to serve. Serves 4