Serving New Haven and Fairfield Counties | Contact: (203) 895-2783
Menu
Menu
Fairfield Market Report March 2022
Market Overview
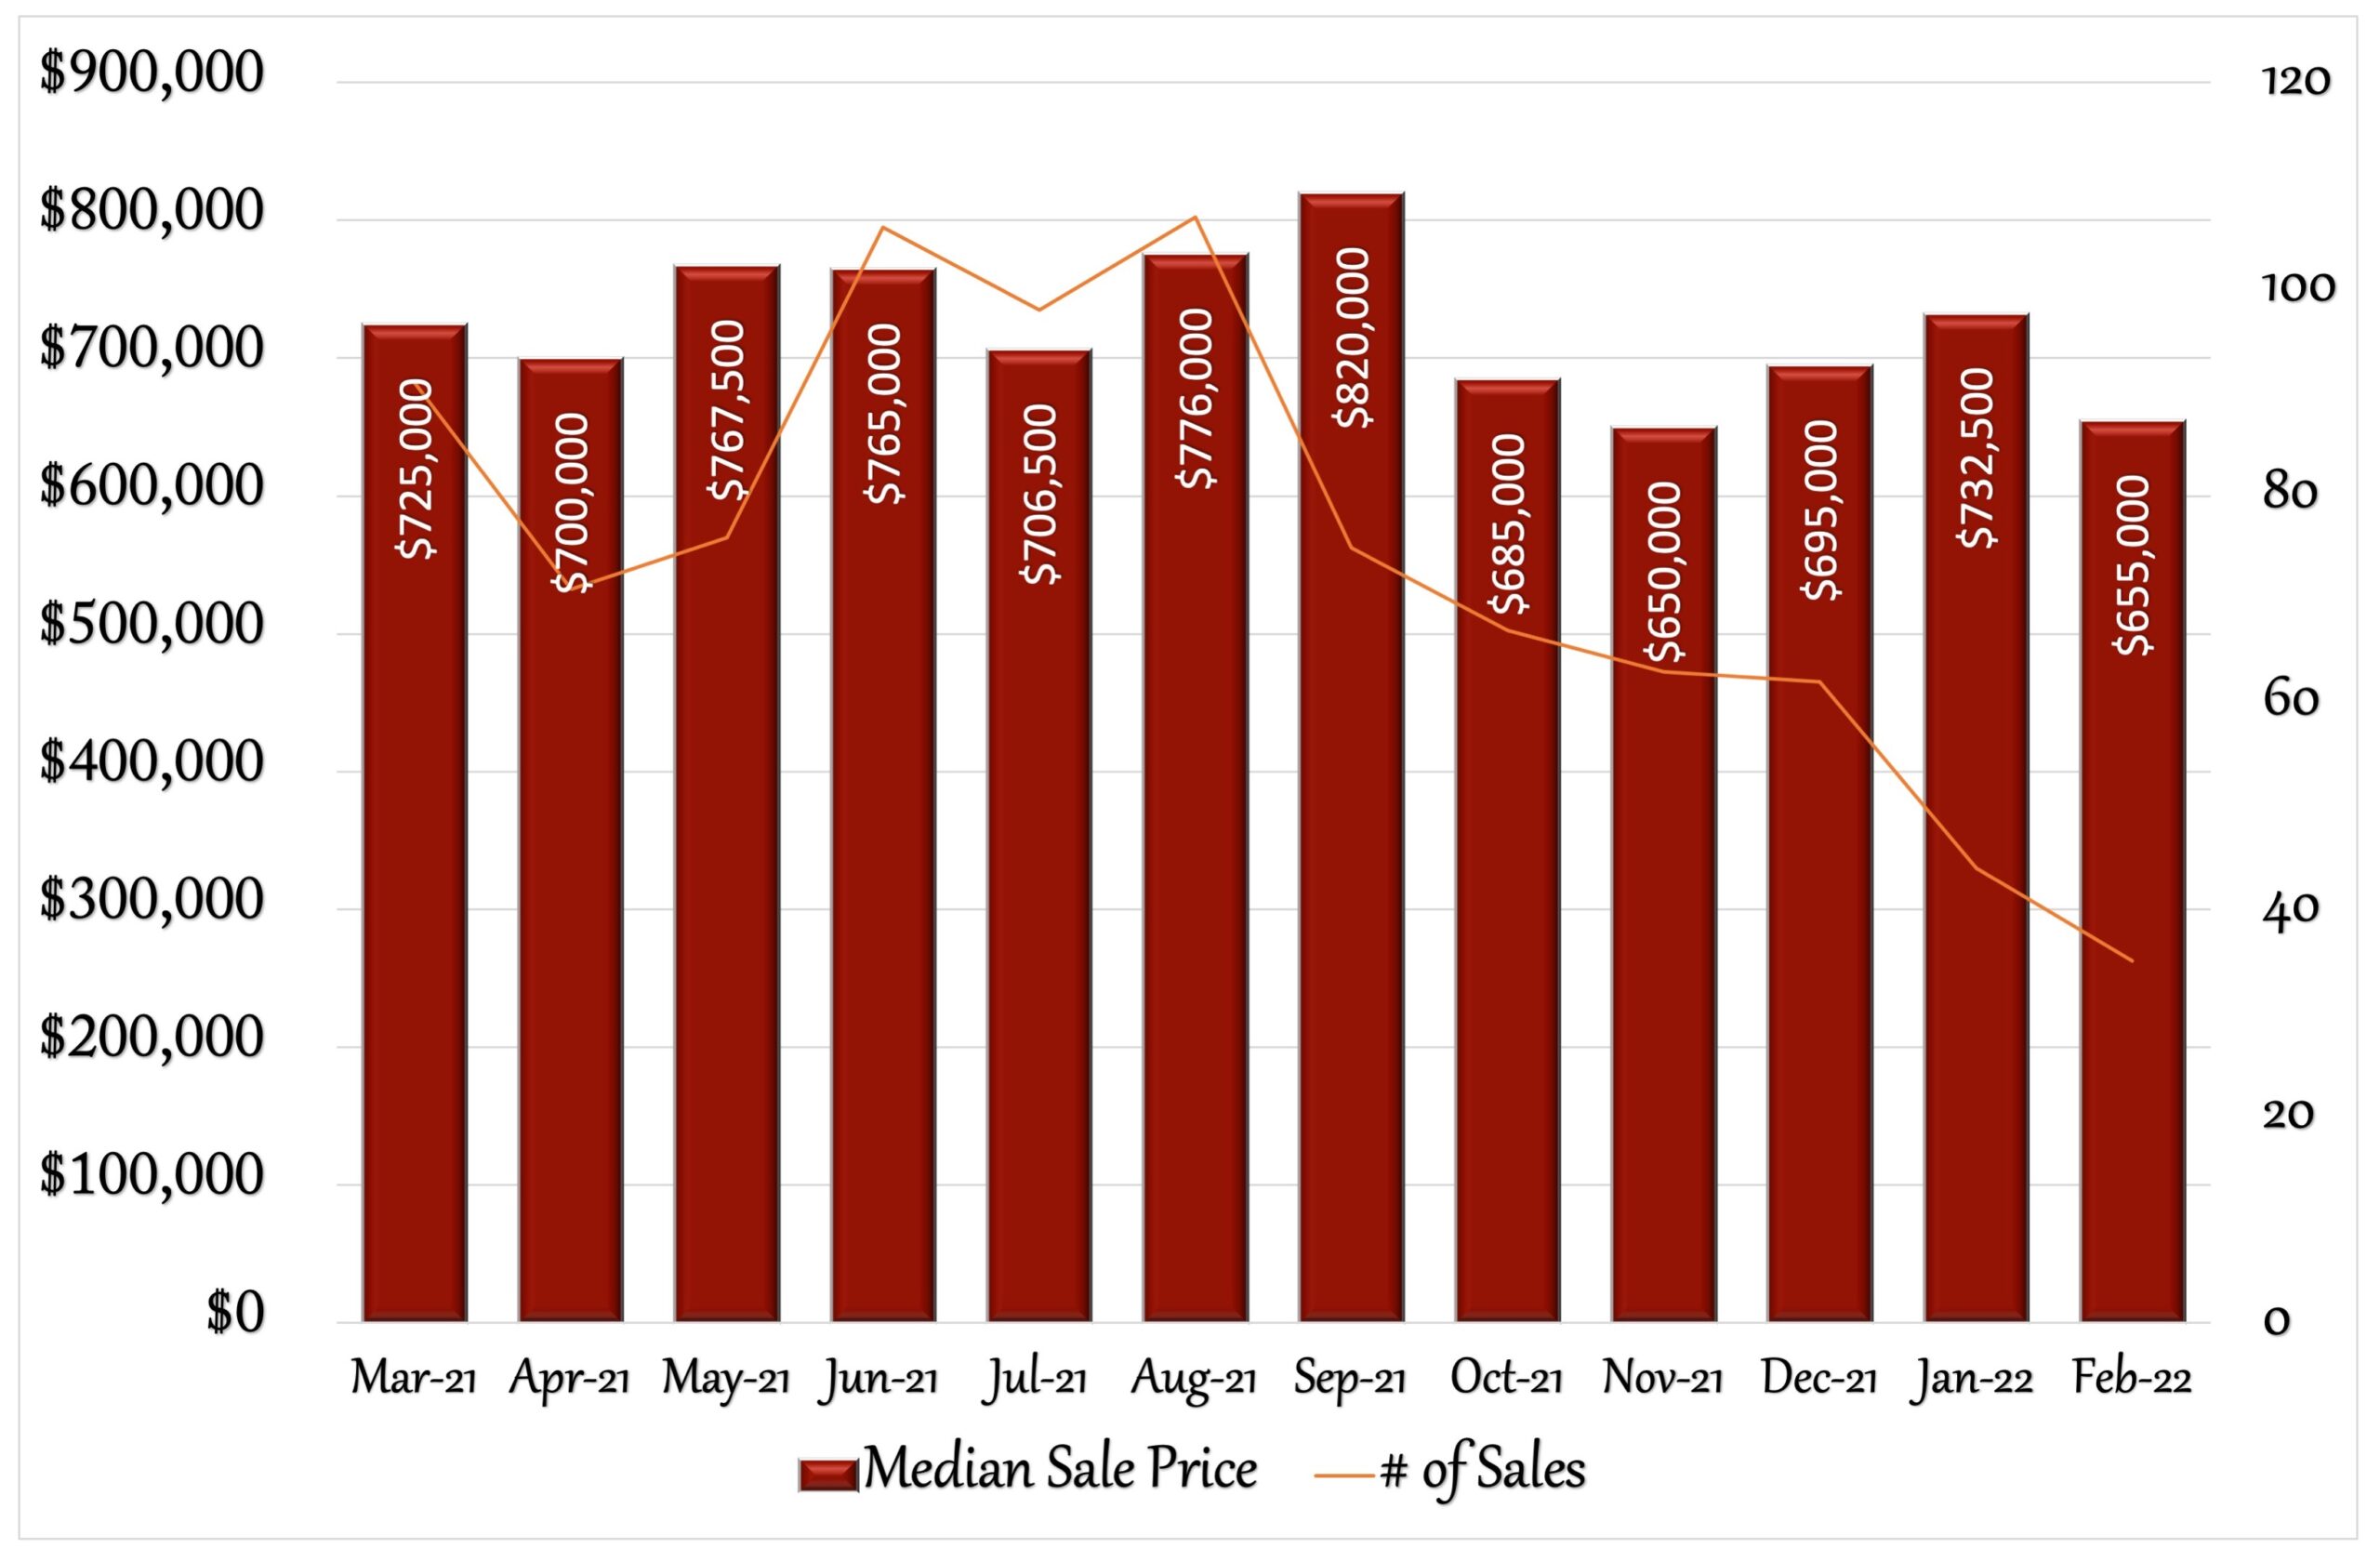
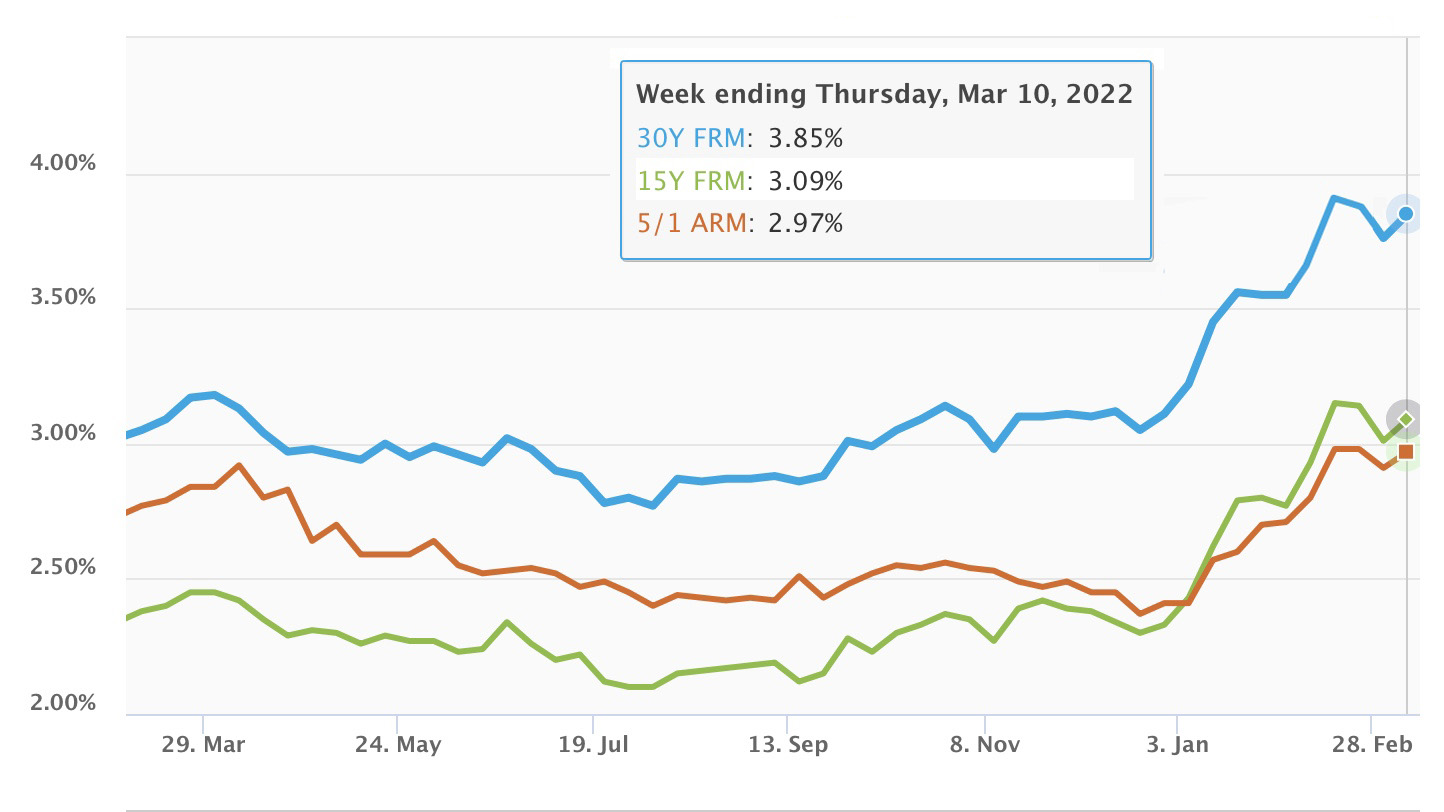
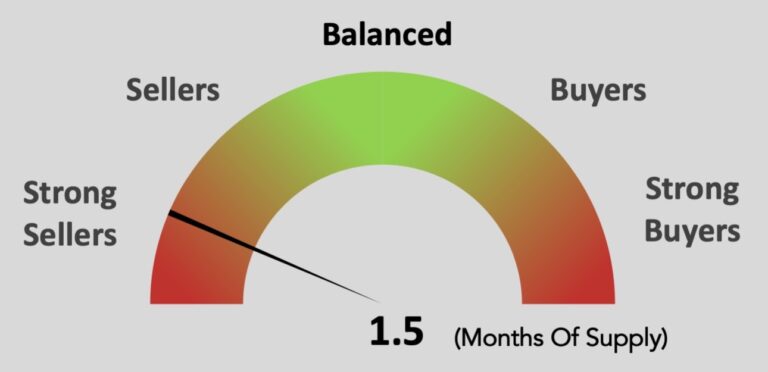
February saw a decrease in home values of about 10% from the previous month in Fairfield. The median sales price for a single family home fell from $732,500 to $655,000. State wide, home values have been down, continuing a trend from their peak in June 2021. Also after peaking in June at $685,000, home values through January in Fairfield County have been trending lower each month, save for a brief rally in November and December. February’s median sales price for the county however, increased from $550,000 to $567,500. Fewer homes sold in Fairfield than in previous months. While October, November and December were seeing sales numbers in the 60’s, January had 44 closings and February had just 35. This may simply be reflecting seasonal trends, as sales in January 2020, 2019 and 2018 were at 36, 48 and 37 respectively, fairly close to current sales number’s. Inventory, while still low, improved somewhat with 75 new listings vs. 49 in January, and the months of supply ticked up slightly from 1.4 to 1.5, still keeping Fairfield in a solid seller’s market. Houses sold only a few days slower, 48 days vs. 45 days previously, and on average sellers got 100% of the list price at closing. Given the recent challenging political and economic climate, it is difficult to predict what the next few months will bring. Although unemployment has reached pre-pandemic lows, inflation has hit 40 year highs. Interest rates, after a brief decrease in late February, continued their rise in early March, back up to 3.85%. Still historically low, but potentially putting pressure on buyers budgets when factoring in increased property values over the previous 12 months and the recent rise in inflation. Many buyers still want to lock in these historically low rates before rates and home prices increase further moving into the Spring market. With such low inventory, buyers are eager for more home choices. For anyone considering a move, this is still a great time to sell a house in Fairfield. Do you know anyone looking for more information about their real estate market? I’d be happy to help.
12 Month Sales Activity
Housing Stats
(change from previous month)
| Median Sale Price: | $655,000 |
| change: | -10.58% |
| YTD change: | -10.58% |
| 12 month change: | -3.61% |
| Units Sold: | 35 |
| change: | -20.45% |
| Active Listings: | 110 |
| change: | 8.91% |
| New Listings: | 75 |
| change: | 53.06% |
| Days on Market: | 48 |
| change: | 4.35% |
| Months of Supply: | 1.50 (Seller's Market) |
| change: | 7.14% |
Interest Rates
Market Temperature
Local Real Estate Price Trends
| 1-Jan | 1-Feb | Change | |
| Bethel | $599,000 | $345,500 | -42.32% |
| Bridgeport | $310,000 | $287,500 | -7.26% |
| Brookfield | $409,300 | $490,000 | 19.72% |
| Danbury | $402,000 | $365,000 | -9.20% |
| Easton | $630,000 | $1,365,000 | 116.67% |
| Fairfield | $732,500 | $655,000 | -10.58% |
| Milford | $420,000 | $425,000 | 1.19% |
| Monroe | $530,250 | $499,000 | -5.89% |
| N. Haven | $475,000 | $500,000 | 5.26% |
| Newtown | $349,900 | $380,000 | 8.60% |
| Orange | $516,000 | $460,000 | -10.85% |
| Oxford | $534,500 | $482,450 | -9.74% |
| Redding | $697,500 | $815,000 | 16.85% |
| Ridgefield | $771,000 | $650,000 | -15.69% |
| Seymour | $256,630 | $350,000 | 36.38% |
| Shelton | $400,000 | $494,500 | 23.63% |
| Stratford | $339,500 | $385,000 | 13.40% |
| Trumbull | $501,500 | $522,400 | 4.17% |
| Weston | $1,250,000 | $1,034,500 | -17.24% |
| Westport | $2,200,000 | $1,605,000 | -27.05% |
Tips
How To Save A Little At The Pump
With gas prices reaching record highs, many find their monthly budget taking a huge hit. Below are a few ways to take the sting out of the recent increases and make less frequent stops to fill up:
Carpool: perhaps the greatest impact on gas consumption, cutting out even 1 day of commuting by ride sharing can make a big difference.
Drive More Efficiently: speeding, braking and rapid acceleration take a huge bite out of a cars mpg, by as much as 15%-30%.
Slow Down: driving at excessive speeds negatively affect fuel economy. Driving 65 mph can save between 6-7 mpg compared to driving 75 mph.
Aerodynamics: Removing the roof cargo box when not needed can save between 2-9 mpg.
Cruise Control: can improve fuel economy by as much as 14% when used appropriately.
Reduce Idle Time: A car engine consumes one quarter to one half gallon of fuel per hour when idling. Turn off the engine if idling for more than 1 minute.
Check Tire Pressure: collectively US drivers waste about 1% of all gas consumed due to underinflated tires. Check the sticker on the driver’s side door jamb.
Shop Around: use an app such as GasBuddy to find the best prices at local gas stations.
Rest Easy by Building Simple Sleep Habits
Tossing and turning at night could be a sign that our circadian rhythm is out of sync. This built-in alarm clock affects our moods, metabolism and immune system.
Circadian rhythm is tied to natural light. Sunshine is meant to kickstart our day, while darkness is our cue to rest. This worked great when most people were farmers and ranchers, but today, we now have multiple screens keeping us awake, and bright blue screens can trick our brains into thinking it’s daytime. Our schedules are inconsistent and exacerbated by hopping time zones in video calls. All of this has thrown our circadian rhythm for a loop.
Here are a few ideas to keep your circadian rhythm right-side up.
- Establish and maintain a daily routine.
- Spend time outdoors during the day.
- Refrain from stimulants like coffee, nicotine or alcohol in the evenings.
- Avoid all screens for an hour before going to bed.
- Keep your bedroom cool and dark to encourage maximum restfulness.
Real Estate Headlines
Home Prices Set Records Ahead of Spring Buying: Spring may have sprung early in the housing market. The U.S. median list price set a record high of $392,000 in February, according to realtor.com®’s Monthly Housing Trends Report. Many markets continued to post double-digit annual price gains. Over the last five years, we have seen home prices break records early in the season But this is the first time the record has been broken in February, signaling that competition is already heating up weeks before the start of the spring buying season.
Changes in Homeowner Tenure: The American homeowner tenure average reached 13.2 years in 2021, a slight decline from 2020’s average of 13.5 years. Has homeowner tenure peaked as more Americans move? Homeowner tenure is still up by historical standards; it stood at 10.1 years in 2012 for comparison. The lengthening tenure average in recent years occurred because of older homeowners’ growing desires to age in place, a shortage of homes for sale, and relatively low monthly payments due to record-low mortgage rates, according to an analysis
Homeowners Tempted To Use Equity: Homeowners are seeing record levels of equity in their properties, and many plan to tap into some of that newfound wealth. Mortgage holders have an average of about $185,000 in home equity, according to research from Black Knight. That amount assumes retaining a 20% stake in the property. The options to draw money from a home are typically cash-out refinancing, home equity lines of credit, and reverse mortgages. Most lenders will require owners maintain at least 20% equity in their home.
Housing Wealth Skewed to Rich Homeowners: Homeowners across the board are feeling richer from rising home prices, but the wealthiest have enjoyed the largest gain, according to a report from the National Association of REALTORS®. From 2010 to 2020, about 71% of the increase in housing wealth was in high-income households. Low- and middle-income households received a smaller share of housing wealth gains, according to the NAR report. High-income homeowners held 28% of all U.S. housing wealth in 2010, but by 2020, that percentage had grown to 42.6%.
Millennials Fear More Debt: Debt is a significant concern for millennials, and their worries may be so great that they are reluctant to buy a home. Nearly half of the millennials surveyed in January by Rocket Mortgage said they had delayed their decision to purchase a home due to fear of falling into debt. They also reported wanting to save more money for a down payment and being concerned by high costs of housing. Further, the age group has shown itself as more debt-averse than older generations. For example, credit card debt among millennials is much lower than older age groups (averaging $4,300 for millennials compared to $7,155 for Gen Xers and $6,043 for baby boomers).
Mortgage Rates Rise Mid-March: Following two weeks of declines, mortgage rates rose this week as U.S. Treasury yields increased. Over the long-term, rates are expected to continue to rise as inflation broadens and shortages increasingly impact many segments of the economy. However, uncertainty about the war in Ukraine is driving rate volatility that likely will continue in the short-term.
High Heating Bills Stun Homeowners: Heating bills this winter have left many homeowners in sticker shock, as fuel costs rose from 5% – 100% throughout the country this winter. Natural gas suppliers in Missouri, Mississippi, and Alabama said they raised prices by 96% this year.
3 Mistakes of Novice Sellers: With soaring home prices and high demand, homeowners are finding it a great time to sell. But some sellers—particularly first-timers—may be so caught up in the headlines about the rosy market that their expectations may become clouded. Some of the mistakes of rookie home sellers in the current market include: unrealistic price expectations, accepting the highest offer and trying to FSBO: “For sale by owner”.
Upcoming Events
A new year, all new events. Check out what’s going on throughout Connecticut.
Sales Trends: January - February
February Single-Family Home Sales
(OLP: original list price • LP: list price • SP: sale price • DOM: days on market)
| Address | Style | sq ft | BR | BA (f/h) | OLP | LP | SP | SP/OLP | DOM |
| 41 Robson Pl | Cape Cod, Bungalow | 1,270 | 2 | 1/1 | $499,000 | $499,000 | $530,000 | 106% | 81 |
| 187 Warwick Ave | Colonial | 1,770 | 4 | 3/0 | $719,000 | $719,000 | $775,000 | 108% | 14 |
| 74 Baldwin Ter | Colonial | 3,950 | 4 | 3/1 | $1,949,000 | $1,849,000 | $1,800,000 | 92% | 159 |
| 539 Knapps Hwy | Colonial | 1,310 | 2 | 1/0 | $250,000 | $250,000 | $262,500 | 105% | 22 |
| 78 Rena Pl | Cape Cod | 1,566 | 3 | 2/0 | $529,900 | $529,900 | $530,000 | 100% | 48 |
| 56 Renchy St | Colonial | 1,959 | 2 | 1/1 | $454,500 | $454,500 | $454,500 | 100% | 36 |
| 919 Stillson Rd | Colonial | 3,136 | 4 | 3/1 | $679,000 | $669,000 | $660,000 | 97% | 181 |
| 45 Crane St | Cape Cod | 1,806 | 3 | 2/0 | $549,000 | $549,000 | $675,000 | 123% | 4 |
| 121 Black Rock Ave | Split Level | 1,312 | 3 | 1/1 | $399,000 | $399,000 | $420,000 | 105% | 53 |
| 558 S. Pine Creek Rd | Cape Cod | 1,934 | 4 | 2/0 | $789,000 | $789,000 | $805,000 | 102% | 76 |
| 577 S. Pine Creek Rd | Colonial | 2,636 | 4 | 3/0 | $949,000 | $849,900 | $825,000 | 87% | 76 |
| 95 Clinton St | Colonial | 2,766 | 4 | 2/1 | $1,349,000 | $1,299,900 | $1,275,000 | 95% | 53 |
| 3565 Redding Rd | Ranch, Barn | 3,784 | 5 | 4/1 | $1,000,000 | $939,000 | $835,000 | 84% | 97 |
| 345 Flintlock Rd | Colonial | 5,016 | 6 | 3/1 | $1,275,000 | $1,275,000 | $1,336,000 | 105% | 31 |
| 54 Lloyd Dr | Cape Cod | 1,176 | 3 | 1/0 | $400,000 | $385,000 | $381,000 | 95% | 128 |
| 35 Renchy St | Cape Cod | 1,200 | 3 | 1/0 | $449,900 | $449,900 | $470,000 | 104% | 31 |
| 205 Stillson Rd | Split Level | 1,736 | 4 | 3/0 | $650,000 | $650,000 | $650,000 | 100% | 27 |
| 823 Oldfield Rd | Cape Cod | 1,308 | 3 | 1/0 | $699,900 | $669,000 | $655,000 | 94% | 81 |
| 200 Autumn Ridge Rd | Ranch | 3,424 | 3 | 2/1 | $734,900 | $734,900 | $740,000 | 101% | 46 |
| 108 Colonese Rd | Ranch | 2,122 | 3 | 2/0 | $435,000 | $435,000 | $475,000 | 109% | 13 |
| 129 York Rd | Colonial | 1,714 | 4 | 2/0 | $580,000 | $549,900 | $500,000 | 86% | 72 |
| 93 Taunton Rd | Split Level | 2,333 | 3 | 1/1 | $749,000 | $749,000 | $735,000 | 98% | 70 |
| 103 Bulkley Dr | Colonial | 3,542 | 5 | 2/1 | $999,000 | $999,000 | $1,060,000 | 106% | 24 |
| 45 Northwood Rd | Colonial | 3,217 | 5 | 2/1 | $659,000 | $659,000 | $659,000 | 100% | 5 |
| 254 Penfield Rd | Colonial | 4,856 | 5 | 4/1 | $2,999,000 | $2,999,000 | $3,100,000 | 103% | 22 |
| 1353 Brooklawn Ave | Ranch | 1,288 | 3 | 1/1 | $349,000 | $349,000 | $360,000 | 103% | 17 |
| 42 Victoria Ct | Colonial | 6,151 | 5 | 4/1 | $1,359,000 | $1,359,000 | $1,525,000 | 112% | 20 |
| 37 Bibbins Ave | Cape Cod | 1,462 | 3 | 2/0 | $499,900 | $499,900 | $500,000 | 100% | 75 |
| 51 London Ter | Split Level | 1,944 | 3 | 3/0 | $550,000 | $550,000 | $575,000 | 105% | 18 |
| 145 Old Stratfield Rd | Colonial | 2,368 | 3 | 2/1 | $559,000 | $559,000 | $547,000 | 98% | 42 |
| 73 Partridge Ln | Colonial | 3,200 | 4 | 3/2 | $1,239,000 | $1,239,000 | $1,320,000 | 107% | 112 |
| 63 Henry St | Cape Cod | 2,108 | 3 | 2/0 | $699,000 | $675,000 | $650,000 | 93% | 61 |
| 6 Buckboard Ln | Colonial | 2,520 | 4 | 2/1 | $725,000 | $649,000 | $655,000 | 90% | 222 |
| 35 Helen St | Colonial | 1,080 | 2 | 1/1 | $460,000 | $460,000 | $430,000 | 93% | 67 |
| 211 Coventry Ln | Colonial | 7,586 | 4 | 4/3 | $1,795,000 | $1,795,000 | $1,800,000 | 100% | 17 |
| Units Sold: 35 | $679,000 | $659,000 | $655,000 | 100% | 48 |
Are You Interested In A Real Estate Review?
March 19th: national let’s laugh day | March 21st: world poetry day | March 22nd: as young as you feel day | March 24th: national cocktail day | March 26th: wear a hat day | March 28th: respect your cat day | March 30th: take a walk in a park day