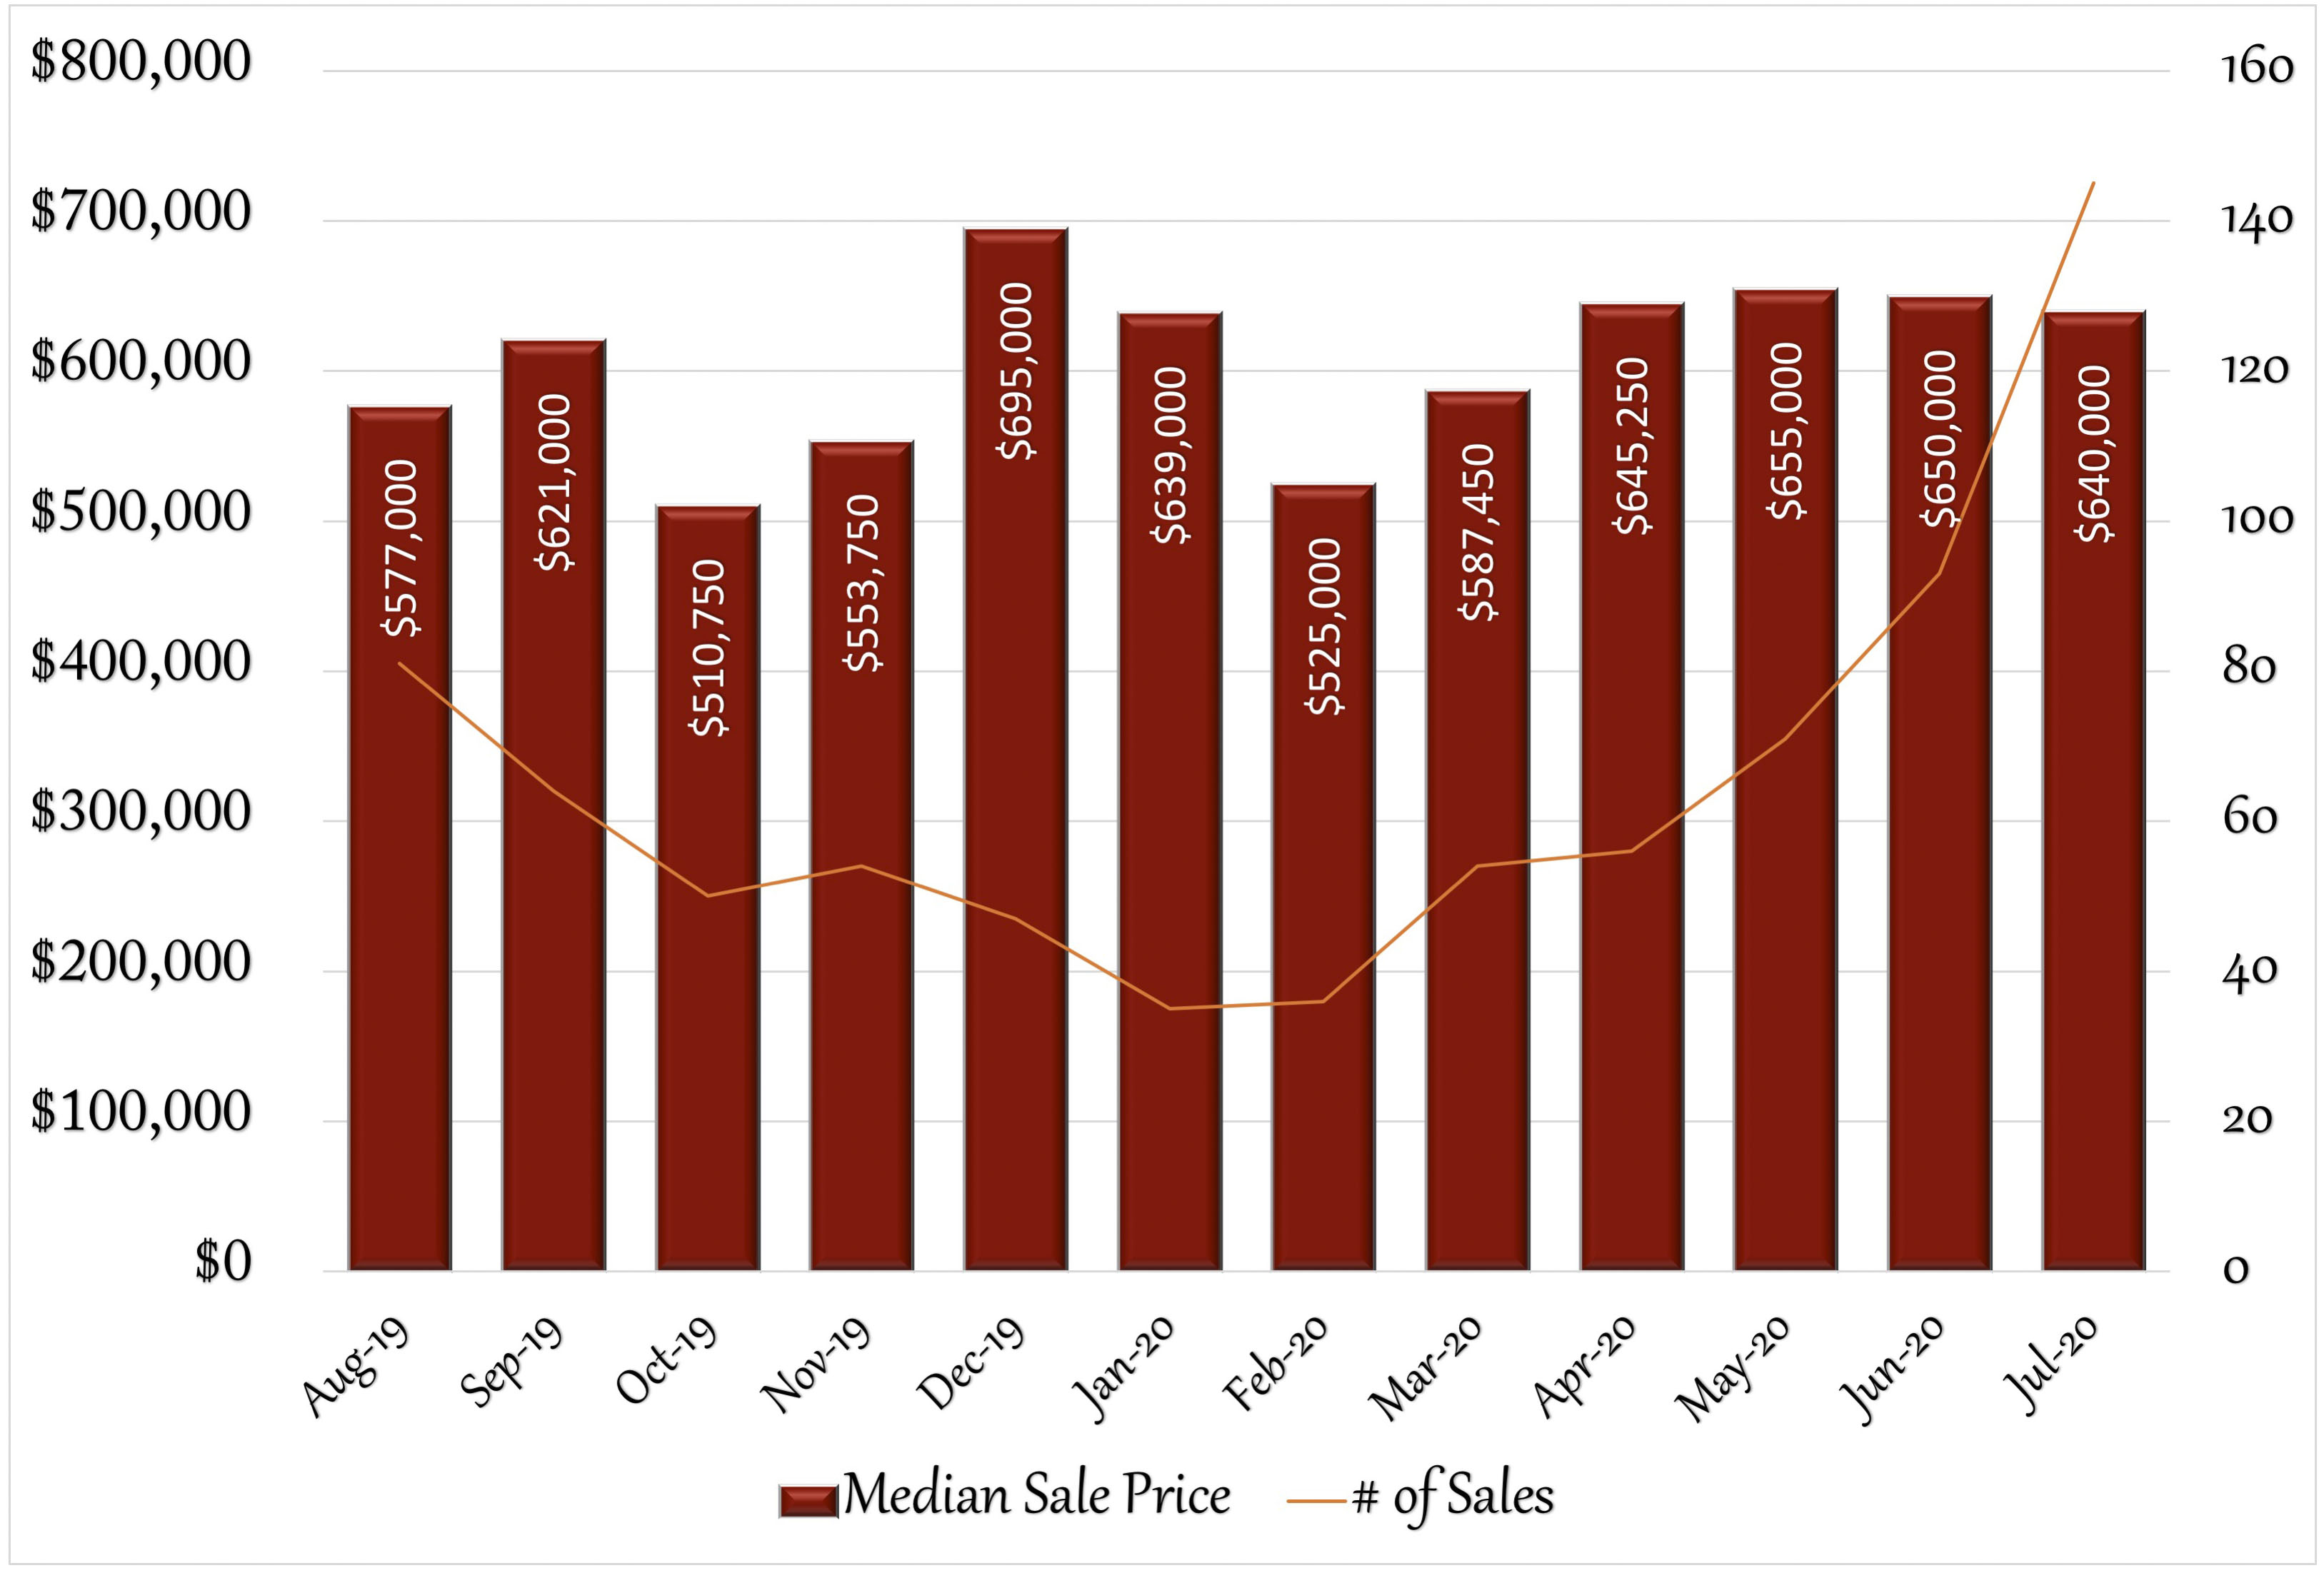
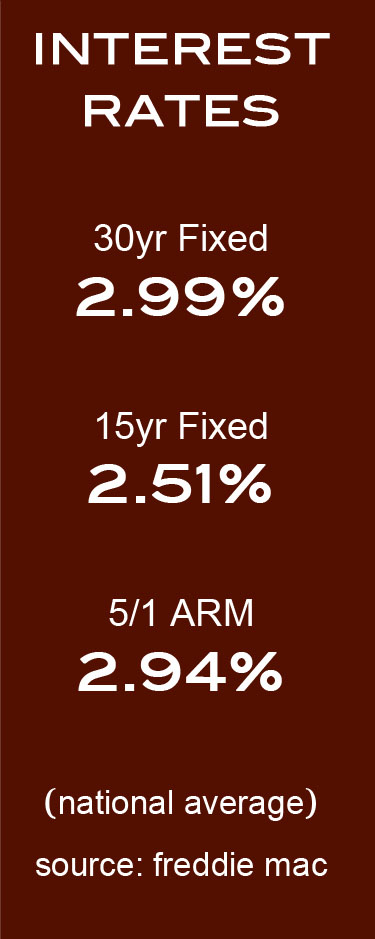
The Fairfield real estate market saw continued stability in July when compared to the previous month’s numbers. The median sales price dipped slightly by 1.54% to $640,000, which brings the price about even with January’s price of $639,000. The number of homes that sold was up over 50%, to 145, as predicted in last month’s increase in pending sales figure, however the number of new listings dropped nearly 13%, from a high of 193 in June to 168 in July. This could forecast a future slowdown. Pending sales were up by over 18%, which will be reflected in August’s closed numbers. The months of supply was at 5.9% bringing Fairfield into a stable market between buyers and sellers. As in many surrounding towns, days on market were short, as buyers were making quick decisions to purchase, and many homes saw multiple bids. Interest rates are still incredibly low: the 30-year fixed rate was at 2.99% by the end of July. This trend continues to push buyers into the market and has been helping sellers overcome anxiety over listing their homes during the ongoing Coronavirus pandemic. Do you know anyone looking for more information about their real estate market? I’d be happy to help.
12 Month Sales Activity
Housing Stats
(change from previous month)
| Median Sale Price: | $635,000 |
| change: | -2.31% |
| YTD change: | -0.63% |
| Units Sold: | 151 |
| change: | 62.37% |
| Active Listings: | 404 |
| change: | -8.39% |
| New Listings: | 167 |
| change: | -13.02% |
| Days on Market: | 59 |
| change: | -11.94% |
| Months of Supply: | 4.40 (Stable Market) |
| change: | -26.67% |
Economic News:
Stock Market: July saw continued gains in the US stock market, with increases in all three major indexes. The Dow Jones was gained 2.3% in July, while the S%P 500 gained 4.2% and the Nasdaq was up 4.3%. Most of the pandemic losses have now recovered: year-to-date, the S&P 500 was up 0.5% by the end of July and the Nasdaq was up 18%. The Dow Jones still has some catching up to do, down 7.8% for the year.
Employment: For a third straight month, the national unemployment rate has dropped. By the end of July, the rate was 10.2%; still higher than the 4.4% pre-pandemic rate. July saw an increase of 1.8 million jobs, primarily in the leisure and hospitality sectors. This increase has slowed compared to June’s 4.8 million jobs added, primarily due to the fear of a second wave of Covid-19 in many states.
Real Estate: Buyers needs have been shifting since the pandemic, focusing less on high end amenities and more on space and outdoor features. Square footage and living space have been top priorities, focusing less on open floor plans and more on personal space for family members.
2020 Local Real Estate Price Trends:
2020 continues to be a strong year for the area real estate markets when compared to 2019’s first 7 months. Most towns show increases in median sales price. Easton, which is still down 1.03% actually improved from last month’s number, which was down 11.52%.
| 1/19-7/19 | 1/20-7/20 | Change | |
| Bethel | $345,000 | $355,750 | 3.12% |
| Bridgeport | $200,000 | $225,000 | 12.50% |
| Easton | $558,250 | $552,500 | -1.03% |
| Fairfield | $583,000 | $639,950 | 9.77% |
| Milford | $299,950 | $338,750 | 12.94% |
| Monroe | $379,950 | $379,500 | -0.12% |
| Newtown | $385,000 | $412,500 | 7.14% |
| Norwalk | $488,445 | $510,000 | 4.41% |
| Orange | $368,500 | $370,000 | 0.41% |
| Redding | $534,000 | $552,500 | 3.46% |
| Ridgefield | $635,000 | $635,000 | 0.00% |
| Shelton | $337,500 | $350,000 | 3.70% |
| Stratford | $250,000 | $275,000 | 10.00% |
| Trumbull | $385,000 | $412,000 | 7.01% |
| Weston | $675,000 | $710,000 | 5.19% |
| Westport | $1,196,250 | $1,250,000 | 4.49% |
| Wilton | $725,000 | $762,500 | 5.17% |
1- Buyers are in a rush: Nationwide, buyers are looking at 3-4 homes before making an offer, compared to 9 homes a year ago.
2- Wish lists are shifting: Home shoppers priorities have been changing. The top desired feature is a home office, followed by outdoor space with an interest in a pool, garden and bigger yards.
3- Commute time is less important: With the increase of remote work, many buyers are expanding their home search further from their offices physical location.
4- Multigenerational households are becoming more common: Trends suggest that Gen Xers and Millennials have been considering sharing a home with an older parent. This translates to need for larger sized homes and first floor living space.
5- Pets are playing a bigger factor in home purchasing decisions: Having space to accommodate a pet, fenced in yard has been a growing factor is some home purchase decisions.
6- First-time homebuyers are on the rise: More young people have been making home purchases prior to marriage, and there has been an increase in roommates pooling their money in order to purchase a house together.
7- Housing tenure may fall: Over the past few years, homeowners have been staying longer in their homes then in past decades. This may change due to a need to find a home that better meets their growing desire for more space and better home workspace.
Due to high unemployment and economic recession, some Americans were predicting a gloomy housing picture. The opposite has been true.
Myth #1: It’s a bad time to sell a home: The reality has been that with record low interest rates, buyers have been sparking bidding wars in many markets with limited inventory.
Myth #2: Home prices are dropping: The opposite has been true. In most markets, home prices have been rising, as much as 7% for the year. Again, fueled by low interest rates and low inventory.
Myth #3: Everyone is rushing to the suburbs: While the suburbs have received an increase in demand from city buyers, this is more the case with wealthier buyers who have the resources to move.
Sales Trends: January-July
July Single-Family Home Sales
(OLP: original list price • LP: list price • SP: sale price • DOM: days on market)
| Address | Style | sq ft | BR | BA (f/h) | OLP | LP | SP | SP/OLP | DOM |
| 205 Nonopoge Rd. | Cape Cod | 1,405 | 4 | 2/0 | $400,000 | $359,900 | $330,000 | 83% | 253 |
| 87 Edgewood Place | Colonial | 1,408 | 3 | 1/1 | $449,000 | $449,000 | $428,000 | 95% | 107 |
| 357 N. Benson Rd. | Cape Cod | 1,430 | 3 | 2/0 | $449,000 | $449,000 | $435,000 | 97% | 146 |
| 1252 Fairfield Woods Rd. | Ranch | 1,614 | 3 | 1/1 | $469,000 | $469,000 | $469,000 | 100% | 78 |
| 446 Stratfield Rd. | Colonial, Antique | 1,980 | 4 | 1/1 | $495,000 | $479,000 | $475,000 | 96% | 53 |
| 80 Poe Court | Raised Ranch | 2,418 | 5 | 3/1 | $495,000 | $495,000 | $475,000 | 96% | 17 |
| 145 Tuckahoe Lane | Cape Cod, Colonial | 1,604 | 3 | 2/0 | $499,900 | $499,900 | $483,000 | 97% | 131 |
| 98 Wheeler Park Ave. | Colonial | 2,015 | 5 | 2/0 | $494,500 | $494,500 | $487,500 | 99% | 68 |
| 1486 Round Hill Rd. | Cape Cod | 2,214 | 4 | 2/0 | $598,000 | $598,000 | $580,000 | 97% | 106 |
| 1677 Bronson Rd. | Cape Cod, Ranch | 2,246 | 4 | 3/0 | $800,000 | $779,000 | $760,000 | 95% | 230 |
| 20 Alden St. | Colonial | 2,735 | 4 | 2/1 | $839,900 | $789,900 | $775,000 | 92% | 35 |
| 221 Tuckahoe Lane | Colonial | 2,100 | 4 | 3/1 | $869,000 | $869,000 | $843,000 | 97% | 29 |
| 2278 Hillside Rd. | Colonial | 8,022 | 5 | 4/2 | $949,000 | $949,000 | $920,000 | 97% | 17 |
| 250 Algonquin Rd. | Colonial | 6,434 | 6 | 6/2 | $1,049,000 | $1,049,000 | $1,029,000 | 98% | 88 |
| 1690 Fairfield Beach Rd. | Colonial, Contemporary | 1,672 | 3 | 2/0 | $1,095,000 | $1,095,000 | $1,050,000 | 96% | 17 |
| 1041 Round Hill Rd. | Colonial | 5,459 | 5 | 4/1 | $1,333,000 | $1,199,000 | $1,142,900 | 86% | 173 |
| 261 Colony St. | Cape Cod | 2,146 | 4 | 1/0 | $375,000 | $375,000 | $375,000 | 100% | 1 |
| 109 Brooklawn Terrace | Ranch | 1,346 | 3 | 1/1 | $399,999 | $399,999 | $399,999 | 100% | 55 |
| 1663 Black Rock Tpke. | Cape Cod | 1,523 | 3 | 2/0 | $409,900 | $409,900 | $400,000 | 98% | 25 |
| 2858 Black Rock Tpke. | Ranch | 1,472 | 2 | 1/0 | $419,900 | $419,900 | $415,000 | 99% | 55 |
| 45 Linley Dr. | Colonial | 3,051 | 4 | 2/1 | $549,000 | $499,000 | $480,000 | 87% | 264 |
| 251 Shoreham Village Dr. | Colonial | 1,536 | 3 | 1/1 | $584,500 | $539,000 | $524,500 | 90% | 207 |
| 50 Jackman Ave. | Colonial | 3,047 | 4 | 4/1 | $699,000 | $699,000 | $660,000 | 94% | 34 |
| 668 Mill Hill Terrace | Cape Cod | 2,132 | 4 | 2/0 | $699,900 | $699,900 | $699,900 | 100% | 17 |
| 760 Galloping Hill Rd. | Colonial, Split Level | 3,647 | 5 | 3/1 | $839,000 | $839,000 | $810,000 | 97% | 46 |
| 55 Guydan Lane | Colonial | 3,984 | 4 | 3/1 | $848,900 | $848,900 | $860,000 | 101% | 26 |
| 40 Walbin Court | Colonial | 4,129 | 4 | 3/1 | $935,000 | $935,000 | $917,500 | 98% | 99 |
| 289 Puritan Rd. | Colonial | 4,100 | 5 | 4/1 | $1,849,000 | $1,849,000 | $1,800,000 | 97% | 20 |
| 397 Westford Dr. | Cape Cod | 1,124 | 3 | 1/1 | $524,900 | $524,900 | $512,500 | 98% | 52 |
| 181 Hulls Hwy. | Cape Cod | 1,229 | 3 | 3/0 | $550,000 | $550,000 | $550,000 | 100% | 2 |
| 157 Tanglewood Lane | Colonial | 2,884 | 4 | 2/1 | $659,000 | $589,000 | $565,000 | 86% | 259 |
| 21 Taintor Dr. | Colonial | 4,038 | 5 | 3/1 | $995,000 | $945,000 | $900,000 | 90% | 327 |
| 76 Paul Place | Colonial, Contemporary | 2,909 | 4 | 3/1 | $1,165,000 | $1,165,000 | $1,100,000 | 94% | 33 |
| 178 Alberta St. | Ranch | 1,100 | 2 | 1/0 | $379,900 | $379,900 | $359,000 | 94% | 132 |
| 785 Church Hill Rd. | Ranch, Split Level | 2,912 | 4 | 3/0 | $525,000 | $525,000 | $505,000 | 96% | 72 |
| 350 Canterbury Lane | Raised Ranch | 1,936 | 3 | 2/1 | $564,500 | $564,500 | $549,000 | 97% | 46 |
| 115 Forest Ave. | Colonial, Half Duplex | 2,850 | 4 | 3/1 | $729,000 | $729,000 | $726,000 | 100% | 110 |
| 386 Random Rd. | Colonial | 3,851 | 4 | 3/1 | $739,000 | $739,000 | $750,000 | 101% | 42 |
| 405 Hill Farm Rd. | Colonial | 3,308 | 4 | 2/1 | $914,900 | $854,900 | $855,000 | 93% | 307 |
| 753 Rowland Rd. | Contemporary | 4,786 | 5 | 4/1 | $2,429,000 | $2,429,000 | $2,315,000 | 95% | 188 |
| 58 Cherry Hill Rd. | Split Level | 2,536 | 4 | 3/1 | $619,000 | $619,000 | $635,000 | 103% | 17 |
| 801 South Pine Creek Rd. | Cape Cod | 2,113 | 3 | 2/0 | $645,000 | $645,000 | $640,000 | 99% | 21 |
| 232 Harvester Rd. | Colonial | 3,800 | 4 | 2/1 | $825,000 | $779,000 | $770,000 | 93% | 111 |
| 261 Whites Hill Lane | Contemporary | 5,515 | 5 | 4/2 | $1,399,999 | $1,399,999 | $1,360,000 | 97% | 24 |
| 125 Brett Lane | Colonial | 7,764 | 6 | 4/2 | $1,595,000 | $1,400,000 | $1,360,000 | 85% | 205 |
| 541 Sasco Hill Rd. | Colonial | 11,999 | 5 | 7/3 | $2,994,000 | $2,295,000 | $2,125,000 | 71% | 427 |
| 305 Alma Dr. | Ranch | 1,528 | 3 | 2/0 | $535,000 | $535,000 | $536,000 | 100% | 28 |
| 700 Fairfield Woods Rd. | Cape Cod | 1,496 | 3 | 1/0 | $379,000 | $379,000 | $360,000 | 95% | 100 |
| 331 Stratfield Rd. | Colonial | 2,617 | 5 | 2/1 | $525,000 | $465,000 | $375,000 | 71% | 82 |
| 103 Brooklawn Parkway | Colonial | 1,667 | 3 | 2/0 | $449,900 | $449,900 | $415,000 | 92% | 173 |
| 120 Palamar Dr. | Colonial | 1,853 | 3 | 1/1 | $500,000 | $500,000 | $500,000 | 100% | 17 |
| 150 Sunset Ave. | Ranch | 1,632 | 3 | 2/0 | $575,000 | $575,000 | $555,000 | 97% | 43 |
| 163 Springer Rd. | Colonial | 2,926 | 4 | 2/1 | $839,000 | $839,000 | $795,000 | 95% | 48 |
| 2742 Sturges Hwy. | Colonial | 2,900 | 4 | 2/1 | $850,000 | $850,000 | $835,000 | 98% | 32 |
| 109 Jeniford Rd. | Colonial | 3,800 | 4 | 4/1 | $929,000 | $915,000 | $895,000 | 96% | 102 |
| 41 Eastlawn St. | Colonial | 2,592 | 5 | 2/1 | $925,000 | $925,000 | $917,000 | 99% | 52 |
| 31 Melody Lane | Colonial, Farm House | 4,388 | 5 | 4/1 | $1,129,000 | $1,099,000 | $1,075,000 | 95% | 151 |
| 160 Golden Pond Lane | Colonial | 7,896 | 6 | 4/2 | $2,599,000 | $2,599,000 | $2,450,000 | 94% | 55 |
| 61 Cardinal St. | Cape Cod | 1,581 | 3 | 1/1 | $309,000 | $309,000 | $310,000 | 100% | 36 |
| 360 Pansy Rd. | Ranch | 1,344 | 3 | 2/0 | $395,000 | $425,000 | $440,000 | 111% | 139 |
| 90 Colonese Rd. | Split Level | 2,385 | 5 | 2/0 | $499,900 | $499,900 | $475,000 | 95% | 29 |
| 90 Colonese Rd. | Split Level | 2,385 | 5 | 2/0 | $499,900 | $499,900 | $475,000 | 95% | 29 |
| 2145 Burr St. | Cape Cod, Ranch | 2,571 | 4 | 3/0 | $579,000 | $579,000 | $500,000 | 86% | 24 |
| 40 Lind St. | Ranch | 1,578 | 2 | 1/0 | $435,000 | $435,000 | $425,000 | 98% | 24 |
| 917 Jennings Rd. | Split Level | 1,769 | 3 | 1/1 | $499,000 | $499,000 | $480,000 | 96% | 103 |
| 136 Wilton Rd. | Cape Cod | 1,762 | 3 | 2/0 | $579,000 | $579,000 | $595,000 | 103% | 18 |
| 152 Dill Rd. | Cape Cod, Colonial | 1,998 | 4 | 2/1 | $819,000 | $819,000 | $810,000 | 99% | 273 |
| 105 French St. | Colonial | 2,024 | 4 | 2/1 | $975,000 | $975,000 | $950,000 | 97% | 15 |
| 160 Granville St. | Cape Cod | 1,408 | 3 | 1/0 | $449,000 | $419,000 | $428,500 | 95% | 77 |
| 116 Reid St. | Farm House | 2,710 | 4 | 2/1 | $824,999 | $824,999 | $815,000 | 99% | 28 |
| 33 Evergreen Hill Rd. | Colonial | 4,399 | 5 | 4/1 | $999,000 | $999,000 | $999,000 | 100% | 26 |
| 2043 Congress St. | Colonial | 5,150 | 4 | 2/1 | $639,000 | $639,000 | $615,000 | 96% | 162 |
| 37 Ross Hill Rd. | Colonial | 1,914 | 3 | 1/1 | $499,999 | $499,999 | $494,000 | 99% | 24 |
| 85 Rhoda Ave. | Colonial, Contemporary | 4,583 | 5 | 5/1 | $2,069,000 | $2,069,000 | $2,000,000 | 97% | 84 |
| 1596 Stratfield Rd. | Bungalow | 1,800 | 2 | 2/0 | $299,000 | $299,000 | $285,000 | 95% | 42 |
| 26 Pickwick St. | Cape Cod | 1,082 | 2 | 1/0 | $325,000 | $325,000 | $325,000 | 100% | 33 |
| 14 Morehouse Dr. | Ranch | 1,900 | 3 | 2/0 | $375,000 | $349,000 | $340,000 | 91% | 60 |
| 185 Webb Rd. | Cape Cod, Colonial | 3,443 | 4 | 3/1 | $728,000 | $728,000 | $728,500 | 100% | 18 |
| 185 Red Oak Rd. | Colonial | 7,402 | 5 | 5/3 | $1,475,000 | $1,439,000 | $1,400,000 | 95% | 126 |
| 101 Rhoda Ave. | Colonial | 3,600 | 4 | 3/1 | $1,639,000 | $1,639,000 | $1,565,000 | 95% | 130 |
| 85 Cummings Ave. | Cape Cod | 1,075 | 3 | 2/0 | $420,000 | $375,000 | $360,000 | 86% | 99 |
| 95 Woodcrest Rd., Unit #95 | Colonial, Half Duplex | 3,354 | 3 | 2/1 | $485,000 | $485,000 | $472,500 | 97% | 40 |
| 163 Windsor Rd. | Split Level | 1,990 | 4 | 1/1 | $539,000 | $499,000 | $486,500 | 90% | 56 |
| 229 Eastfield Dr. | Ranch | 1,740 | 3 | 2/0 | $579,900 | $539,000 | $520,000 | 90% | 132 |
| 1163 Merwins Lane | Cape Cod, Colonial | 2,960 | 5 | 3/1 | $619,000 | $619,000 | $575,000 | 93% | 195 |
| 248 Birch Rd. | Colonial | 1,806 | 3 | 2/0 | $799,999 | $799,999 | $799,999 | 100% | 26 |
| 70 Walbin Court | Colonial | 4,774 | 5 | 3/1 | $999,000 | $999,000 | $930,000 | 93% | 120 |
| 320 Ronald Dr. | Ranch | 1,375 | 3 | 1/0 | $375,000 | $375,000 | $355,000 | 95% | 57 |
| 10 Youngstown Rd. | Cape Cod | 1,271 | 3 | 2/0 | $400,000 | $400,000 | $418,000 | 105% | 6 |
| 955 Mill Plain Rd. | Colonial | 1,740 | 3 | 1/1 | $489,995 | $489,995 | $470,000 | 96% | 79 |
| 1012 Mill Plain Rd. | Colonial, Antique | 2,127 | 4 | 2/1 | $549,000 | $549,000 | $505,000 | 92% | 114 |
| 68 Ludlowe Rd. | Colonial | 1,888 | 3 | 1/1 | $499,500 | $499,500 | $547,500 | 110% | 13 |
| 162 Eastlawn St. | Colonial | 1,839 | 3 | 2/1 | $688,500 | $688,500 | $650,000 | 94% | 131 |
| 132 Charles St. | Colonial | 1,720 | 3 | 2/1 | $649,000 | $649,000 | $659,000 | 102% | 36 |
| 91 Ingleside Rd. | Colonial | 2,796 | 4 | 2/1 | $799,900 | $749,900 | $735,000 | 92% | 156 |
| 88 Overhill Rd. | Colonial | 4,057 | 4 | 3/0 | $899,000 | $899,000 | $899,000 | 100% | 52 |
| 920 Merwins Lane | Colonial | 4,820 | 5 | 3/3 | $949,900 | $949,900 | $915,000 | 96% | 24 |
| 194 Willow St. | Cape Cod, Colonial | 1,665 | 3 | 2/1 | $995,000 | $995,000 | $950,000 | 95% | 96 |
| 131 Oldfield Dr. | Colonial | 2,956 | 4 | 3/1 | $1,050,000 | $1,050,000 | $1,075,000 | 102% | 12 |
| 254 Lucille St. | Colonial | 3,634 | 5 | 3/1 | $1,100,000 | $1,100,000 | $1,100,000 | 100% | 21 |
| 77 Fern St. | Colonial | 3,487 | 5 | 3/1 | $1,449,000 | $1,385,000 | $1,367,500 | 94% | 117 |
| 160 Edward St. | Colonial | 3,300 | 5 | 4/1 | $1,649,000 | $1,559,000 | $1,544,000 | 94% | 98 |
| 494 Harbor Rd. | Antique | 4,360 | 5 | 3/1 | $1,750,000 | $1,750,000 | $1,700,000 | 97% | 44 |
| 246 Bennett St. | Ranch | 2,186 | 4 | 3/0 | $419,900 | $419,900 | $419,900 | 100% | 15 |
| 840 Sturges Hwy. | Colonial | 2,628 | 4 | 2/1 | $699,000 | $699,000 | $692,000 | 99% | 36 |
| 130 Brookview Ave. | Colonial | 1,964 | 4 | 1/1 | $389,000 | $389,000 | $375,000 | 96% | 84 |
| 10 High Circle Lane | Ranch | 2,099 | 3 | 2/0 | $475,000 | $459,900 | $453,000 | 95% | 55 |
| 400 Cascade Dr. | Ranch, Other | 2,500 | 5 | 3/0 | $539,000 | $539,000 | $515,000 | 96% | 75 |
| 225 Harvester Rd. | Colonial | 2,640 | 4 | 2/1 | $759,000 | $759,000 | $759,000 | 100% | 24 |
| 295 Crestwood Rd. | Colonial | 3,235 | 4 | 3/1 | $949,000 | $914,000 | $889,000 | 94% | 129 |
| 76 Geneva Terrace | Ranch | 1,708 | 3 | 1/1 | $389,000 | $389,000 | $394,000 | 101% | 22 |
| 660 Stillson Rd. | Split Level | 1,588 | 3 | 1/1 | $449,000 | $419,000 | $400,000 | 89% | 206 |
| 21 Ludlowe Court | Cape Cod | 1,296 | 3 | 1/1 | $4,150,000 | $415,000 | $420,000 | 10% | 23 |
| 506 Lakeview Dr. | Ranch | 1,200 | 2 | 2/0 | $479,000 | $459,000 | $438,000 | 91% | 272 |
| 85 Chapman Ave. | Colonial | 2,347 | 3 | 3/1 | $514,000 | $495,000 | $485,000 | 94% | 65 |
| 67 Mona Terrace | Cape Cod | 1,692 | 4 | 2/0 | $795,000 | $725,000 | $670,000 | 84% | 135 |
| 11 Oldfield Dr. | Cape Cod | 2,140 | 4 | 2/0 | $649,000 | $649,000 | $675,000 | 104% | 40 |
| 32 Orange St. | Colonial | 3,318 | 4 | 2/1 | $715,000 | $715,000 | $711,000 | 99% | 42 |
| 112 Sasco Hill Terrace | Cape Cod | 2,118 | 3 | 2/0 | $839,000 | $839,000 | $824,000 | 98% | 73 |
| 199 Osborne Hill Rd. | Colonial, Farm House | 4,200 | 5 | 4/0 | $1,048,900 | $1,048,900 | $1,035,000 | 99% | 77 |
| 426 Knapps Hwy. | Colonial, Farm House | 1,817 | 3 | 2/0 | $425,000 | $425,000 | $432,000 | 102% | 65 |
| 320 Warner Hill Rd. | Colonial | 3,434 | 5 | 2/1 | $1,249,000 | $1,149,000 | $1,118,000 | 90% | 39 |
| 141 Veres St. | Colonial, Contemporary | 3,400 | 4 | 3/2 | $1,179,000 | $1,179,000 | $1,179,000 | 100% | 30 |
| 199 Henderson Rd. | Colonial | 1,338 | 2 | 2/0 | $434,900 | $429,900 | $405,000 | 93% | 63 |
| 45 Norwegian Woods | Colonial | 2,655 | 4 | 2/1 | $849,000 | $849,000 | $849,000 | 100% | 15 |
| 95 Wellington Dr. | Colonial | 4,050 | 4 | 3/0 | $899,000 | $899,000 | $900,000 | 100% | 18 |
| 58 South Gate Lane | Colonial | 3,041 | 3 | 2/1 | $1,685,000 | $1,725,000 | $1,450,000 | 86% | 113 |
| 3715 Park Ave. | Ranch | 2,024 | 3 | 2/0 | $370,000 | $370,000 | $371,500 | 100% | 17 |
| 124 Juniper Lane | Cape Cod, Colonial | 2,114 | 4 | 3/0 | $699,000 | $675,000 | $665,000 | 95% | 126 |
| 144 Alvin St. | Colonial | 1,918 | 3 | 2/0 | $449,000 | $449,000 | $440,000 | 98% | 23 |
| 185 Lindamir Lane | Raised Ranch, Hi-Ranch | 1,910 | 3 | 2/1 | $544,000 | $544,000 | $544,000 | 100% | 32 |
| 208 Soundview Ave. | Raised Ranch | 1,952 | 3 | 2/0 | $430,000 | $410,000 | $390,000 | 91% | 164 |
| 522 High St. | Cape Cod | 1,065 | 3 | 1/0 | $439,000 | $409,000 | $380,000 | 87% | 37 |
| 429 Toll House Lane | Ranch | 1,708 | 3 | 2/0 | $384,900 | $399,900 | $390,000 | 101% | 3 |
| 193 Hulls Hwy. | Cape Cod | 1,800 | 4 | 2/0 | $569,000 | $569,000 | $550,000 | 97% | 14 |
| 80 Old Dam Rd. | Colonial | 1,822 | 4 | 2/1 | $700,000 | $700,000 | $700,000 | 100% | 48 |
| 226 Saxonwood Rd. | Colonial | 2,950 | 4 | 2/1 | $725,000 | $725,000 | $715,000 | 99% | 43 |
| 1020 Merwins Lane | Barn | 3,050 | 2 | 2/1 | $998,000 | $998,000 | $998,000 | 100% | 111 |
| 1085 Merritt St. | Colonial | 1,115 | 3 | 1/1 | $429,000 | $399,000 | $375,000 | 87% | 86 |
| 91 Glover St. | Cape Cod | 2,323 | 4 | 2/0 | $545,000 | $529,500 | $520,000 | 95% | 262 |
| 15 Windermere St. | Colonial | 3,360 | 4 | 2/2 | $699,000 | $679,000 | $650,000 | 93% | 140 |
| 63 Centerbrook Rd. | Colonial | 2,176 | 4 | 3/0 | $725,000 | $725,000 | $740,000 | 102% | 33 |
| 1880 Hillside Rd. | Colonial | 3,891 | 4 | 3/1 | $1,099,000 | $899,000 | $892,000 | 81% | 120 |
| 535 Hoydens Hill Rd. | Colonial | 4,651 | 5 | 3/1 | $1,049,000 | $1,049,000 | $1,049,000 | 100% | 121 |
| 1450 Hillside Rd. | Colonial | 5,726 | 6 | 6/2 | $2,500,000 | $2,500,000 | $2,350,000 | 94% | 215 |
| Units Sold: 145 | $649,000 | $645,000 | $640,000 | 97% | 55 |