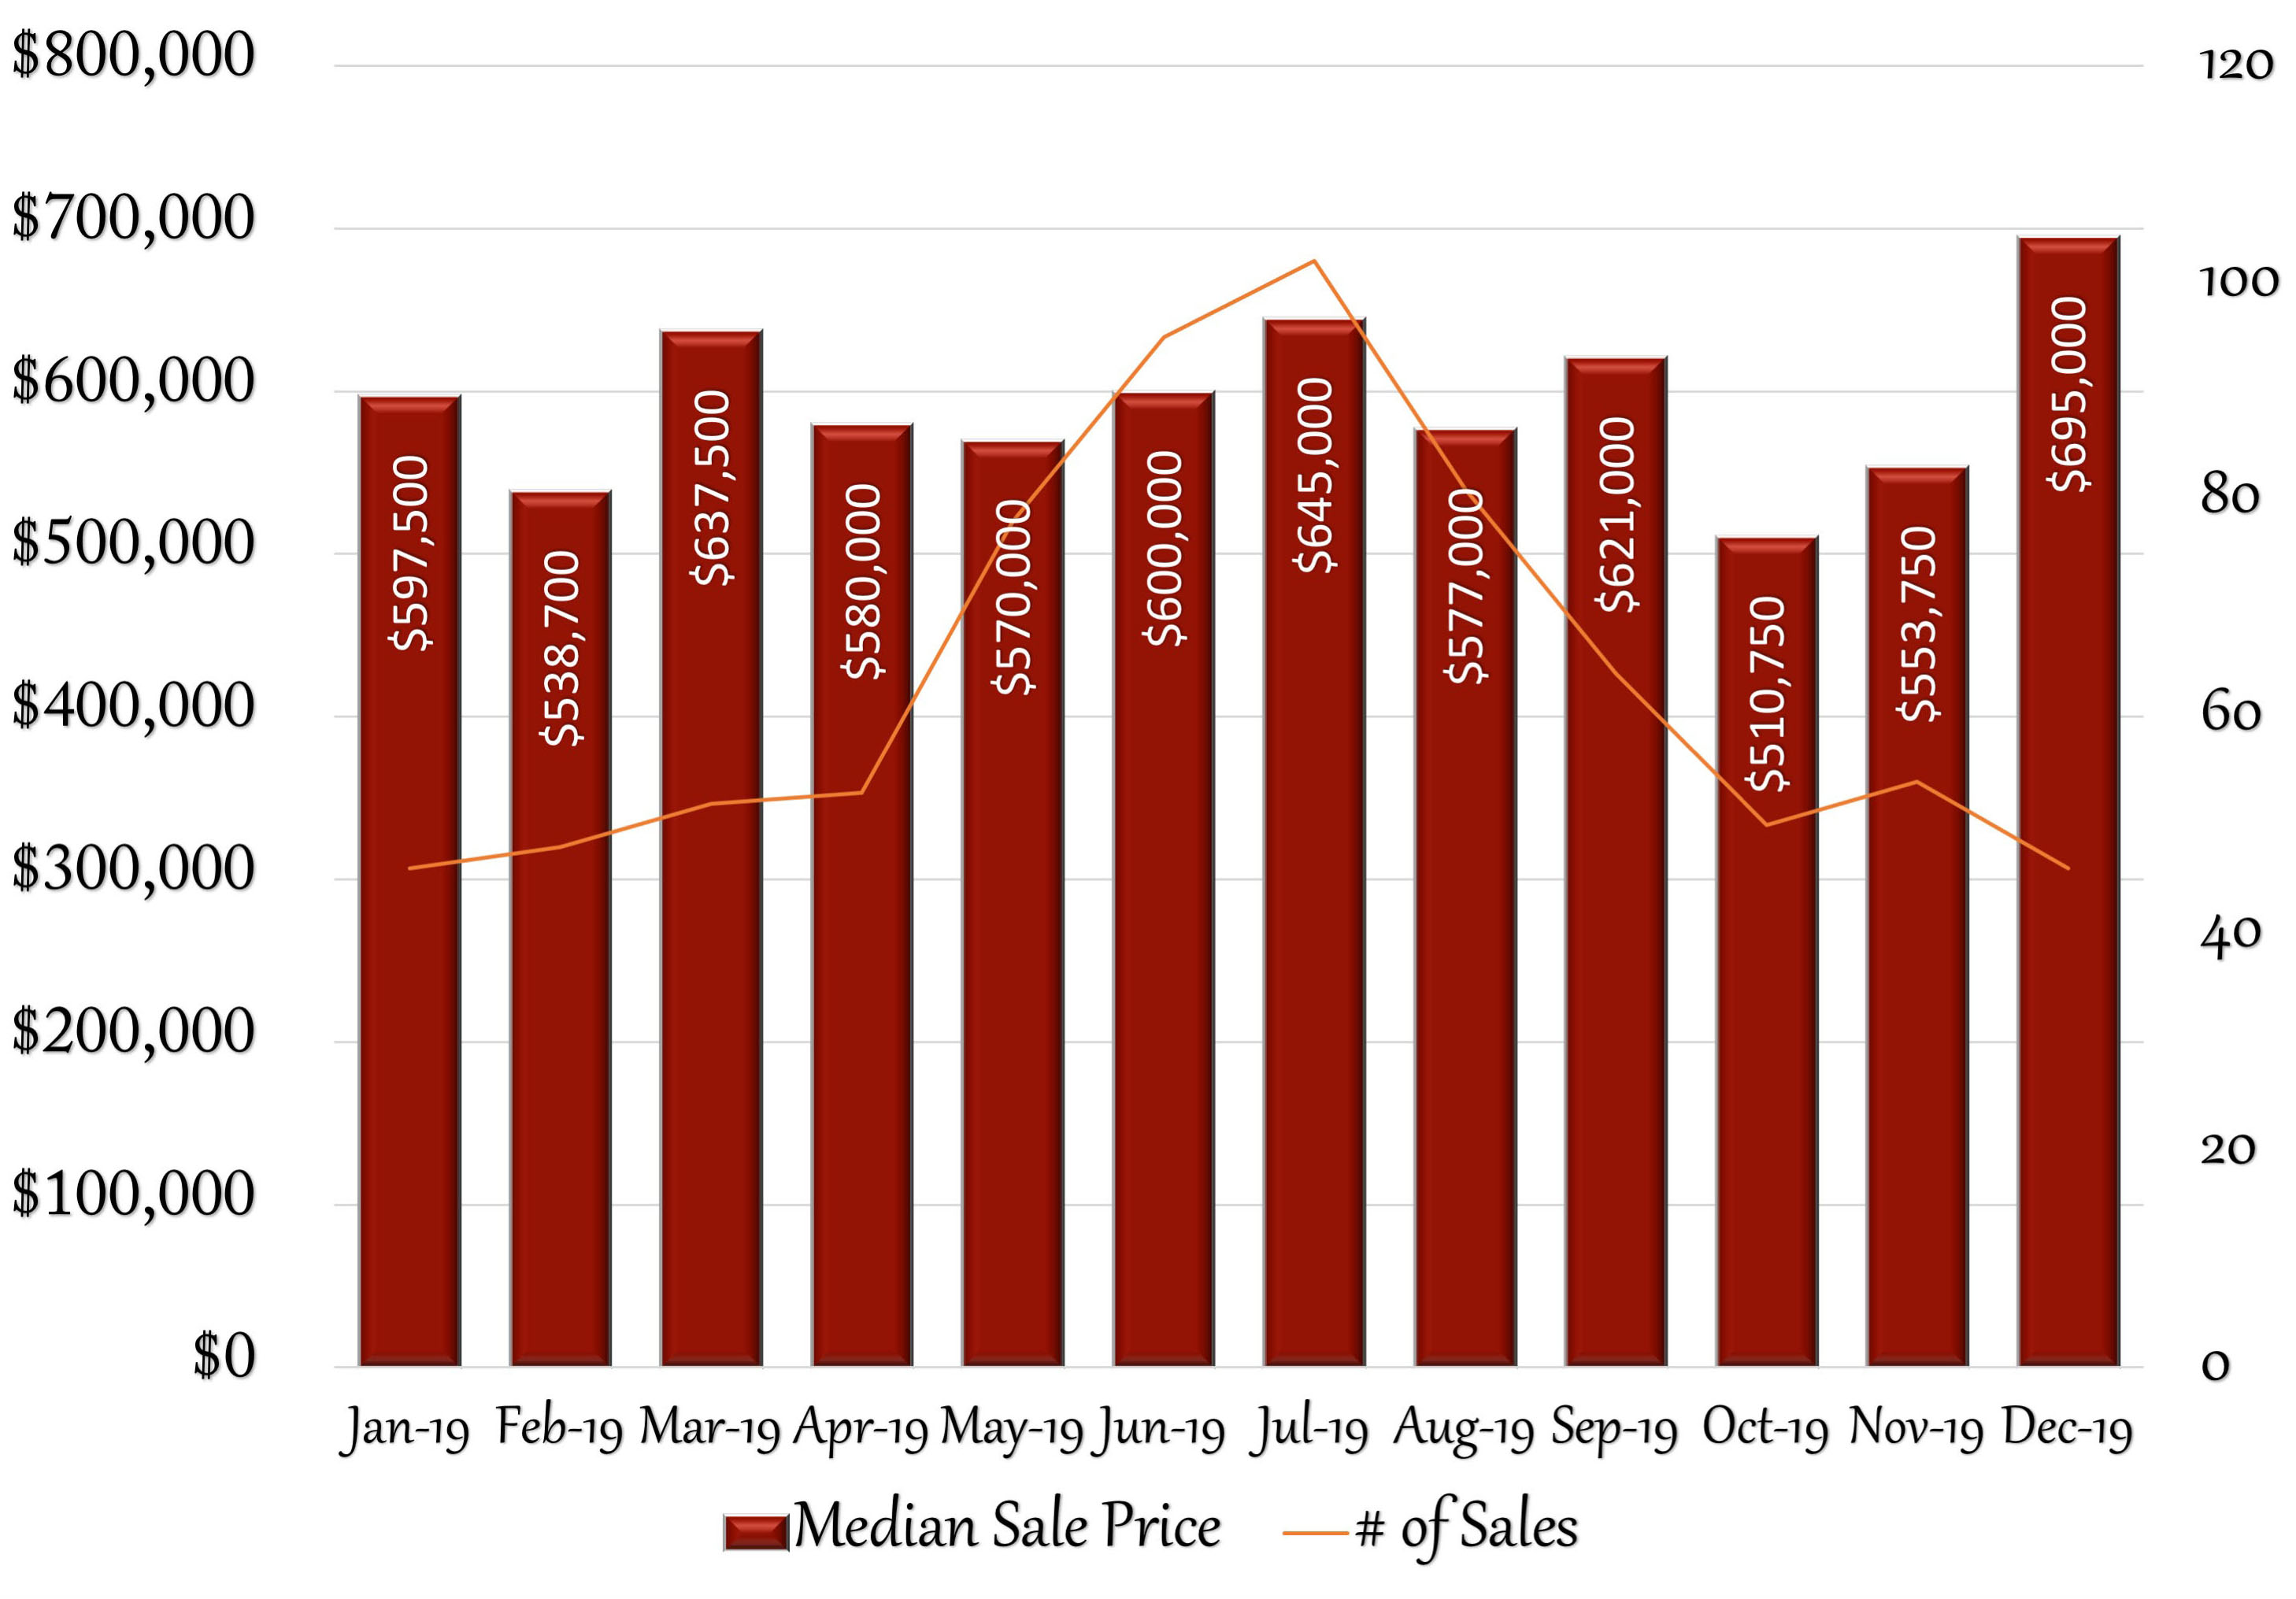
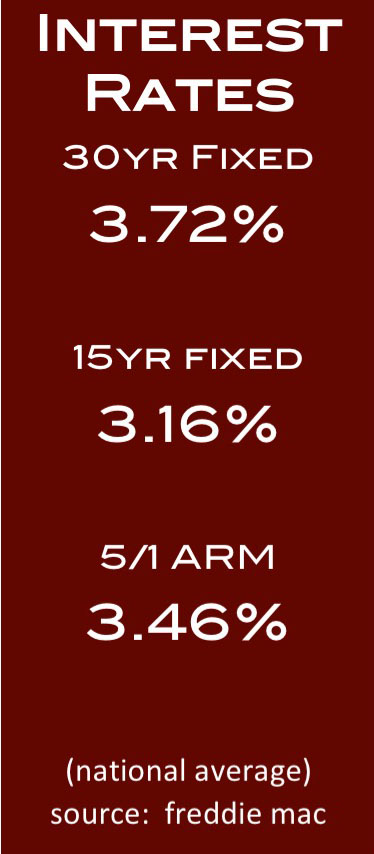
Fairfield’s housing market saw some noticeable improvements from November’s numbers. Perhaps most promising was that the months of supply dropped below 6, from 6.9 to 5.2 months, bringing Fairfield into a balanced market between buyers and sellers for the first time since February 2018. The median sales price spiked sharply by 25.51% to $695,000, the highest it has been since July 2018. Although encouraging, these numbers don’t necessarily represent a turnaround from the slower market of 2019. The number of houses sold was 46 out of 338 offered for sale, and the number of new listings was 41, perhaps reflecting sellers desire to hold off for a more active Spring market. Interest rates still continue to be low, with the 30-year fixed rate at 3.72% at the end of December. If you have any questions, or if you know anyone who is thinking of buying or selling real estate, I’d be happy to speak with you.
12 Month Sales Activity
Housing Stats
(change from previous month)
| Median Sale Price: | $695,000 |
| change: | 25.51% |
| YTD change: | 16.32% |
| Units Sold: | 46 |
| change: | -14.81% |
| Active Listings: | 338 |
| change: | -22.48% |
| New Listings: | 41 |
| change: | -31.67% |
| Days on Market: | 82 |
| change: | -21.90% |
| Months of Supply: | 5.20 (Stable Market) |
| change: | -24.64% |
December Single-Family Home Sales
(OLP: original list price • LP: list price • SP: sale price • DOM: days on market)
| Address | Style | sq ft | BR | BA (f/h) | OLP | LP | SP | SP/OLP | DOM |
| 15 Beverly Lane | Ranch | 2,523 | 3 | 2/0 | $476,000 | $426,000 | $390,000 | 82% | 25 |
| 178 Glen Ridge Rd. | Ranch | 2,071 | 4 | 2/0 | $339,000 | $339,000 | $345,000 | 102% | 16 |
| 100 Hemlock Hills Rd. N. | Colonial | 3,208 | 4 | 3/1 | $799,000 | $799,000 | $750,000 | 94% | 120 |
| 42 Jarvis Court | Ranch | 1,196 | 3 | 1/0 | $289,900 | $289,900 | $280,000 | 97% | 22 |
| 1321 Catamount Rd. | Contemporary, Barn | 3,757 | 3 | 3/0 | $729,000 | $699,000 | $680,000 | 93% | 79 |
| 3270 Sturges Hwy. | Contemporary, Farm House | 4,429 | 4 | 3/1 | $1,698,000 | $1,425,000 | $1,372,000 | 81% | 232 |
| 74 Spinning Wheel Rd. | Cape Cod, Colonial | 1,602 | 4 | 2/0 | $719,000 | $719,000 | $700,000 | 97% | 47 |
| 425 High St. | Cape Cod | 1,278 | 3 | 2/0 | $369,000 | $350,000 | $340,000 | 92% | 137 |
| 102 Arbor Terrace | Colonial | 3,840 | 4 | 3/1 | $924,500 | $924,500 | $875,000 | 95% | 72 |
| 186 Puritan Rd. | Cape Cod | 2,143 | 3 | 2/0 | $849,000 | $799,000 | $770,000 | 91% | 76 |
| 101 Brambly Hedge Circle | Colonial | 5,136 | 5 | 4/2 | $1,149,000 | $1,149,000 | $1,080,000 | 94% | 61 |
| 515 Stillson Rd. | Colonial, Farm House | 2,328 | 4 | 2/0 | $599,000 | $564,990 | $564,990 | 94% | 199 |
| 127 Gorham Rd. | Cape Cod | 1,920 | 3 | 2/0 | $579,000 | $579,000 | $575,000 | 99% | 31 |
| 53 Perry St. | Colonial | 2,062 | 3 | 2/1 | $749,000 | $719,000 | $709,000 | 95% | 107 |
| 161 Cedar Rd. | Colonial | 3,415 | 4 | 5/0 | $1,250,000 | $1,150,000 | $1,150,000 | 92% | 126 |
| 115 Lalley Blvd. | Colonial | 3,801 | 5 | 3/2 | $1,550,000 | $1,449,000 | $1,347,000 | 87% | 233 |
| 6 Wellner Dr. | Colonial | 3,434 | 4 | 3/1 | $625,000 | $615,000 | $609,000 | 97% | 80 |
| 174 Lovers Lane | Colonial | 4,413 | 4 | 4/1 | $850,000 | $819,000 | $800,000 | 94% | 161 |
| 169 Woodrow Ave. | Colonial | 4,166 | 4 | 4/0 | $849,000 | $849,000 | $805,000 | 95% | 82 |
| 395 Fulling Mill Lane N. | Colonial | 4,324 | 5 | 4/1 | $1,199,000 | $1,199,000 | $1,150,000 | 96% | 65 |
| 159 Grasmere Ave. | Colonial | 1,300 | 3 | 2/0 | $359,900 | $330,000 | $330,000 | 92% | 203 |
| 159 Grasmere Ave. | Colonial | 1,300 | 3 | 2/0 | $359,900 | $330,000 | $330,000 | 92% | 203 |
| 79 Brookside Dr. | Raised Ranch | 1,783 | 3 | 2/0 | $499,000 | $489,000 | $450,000 | 90% | 72 |
| 224 Fallowfield Rd. | Colonial | 3,494 | 4 | 2/1 | $750,000 | $725,000 | $700,000 | 93% | 88 |
| 214 Adley Rd. | Colonial | 3,918 | 4 | 2/1 | $899,000 | $874,000 | $835,000 | 93% | 122 |
| 76 Lewis Dr. | Colonial | 2,398 | 3 | 1/1 | $450,000 | $450,000 | $450,000 | 100% | 24 |
| 165 Stella Lane | Colonial | 2,992 | 4 | 3/1 | $769,000 | $769,000 | $745,000 | 97% | 70 |
| 127 Barberry Rd. | Colonial | 3,128 | 4 | 4/1 | $949,000 | $949,000 | $920,000 | 97% | 74 |
| 92 Hawthorne Dr. | Ranch | 1,609 | 2 | 2/0 | $429,000 | $395,000 | $395,000 | 92% | 187 |
| 1261 Congress St. | Colonial | 3,668 | 4 | 2/1 | $609,000 | $570,000 | $545,000 | 89% | 202 |
| 3663 Congress St. | Ranch, Bungalow | 4,448 | 4 | 4/1 | $1,249,000 | $1,079,000 | $1,079,000 | 86% | 72 |
| 279 Jackman Ave. | Colonial | 1,930 | 4 | 2/1 | $399,000 | $399,000 | $405,000 | 102% | 83 |
| 1115 Galloping Hill Rd. | Colonial | 2,072 | 4 | 2/1 | $699,000 | $669,000 | $650,000 | 93% | 59 |
| 1007 Melville Ave. | Colonial, Split Level | 2,232 | 4 | 3/0 | $529,000 | $475,000 | $440,000 | 83% | 152 |
| 18 Gould Ave. | Contemporary, Raised Ranch | 1,927 | 3 | 3/0 | $749,000 | $535,000 | $525,000 | 70% | 341 |
| 1020 Old Post Rd. | Colonial | 2,860 | 5 | 2/1 | $899,000 | $875,000 | $800,000 | 89% | 195 |
| 35 Wellington Dr. | Colonial | 4,368 | 4 | 3/2 | $850,000 | $839,300 | $820,000 | 96% | 41 |
| 152 Brooklawn Terrace | Cape Cod | 1,182 | 3 | 2/1 | $299,000 | $275,000 | $190,000 | 64% | 69 |
| 221 Alberta St. | Cape Cod | 1,114 | 2 | 1/0 | $299,000 | $289,000 | $243,900 | 82% | 95 |
| 3141 North St. | Colonial | 4,665 | 4 | 3/1 | $799,900 | $749,900 | $690,000 | 86% | 118 |
| 423 Riverside Dr. | Colonial | 3,650 | 4 | 5/0 | $1,129,000 | $1,097,000 | $1,025,000 | 91% | 218 |
| 21 S. Benson Cmns. | Colonial | 3,790 | 4 | 2/1 | $829,000 | $789,000 | $745,000 | 90% | 230 |
| 15 Knapps Park Dr. | Cape Cod | 1,075 | 4 | 1/0 | $284,500 | $264,500 | $240,000 | 84% | 101 |
| 95 Sigwin Dr. | Ranch | 1,665 | 3 | 2/0 | $455,000 | $455,000 | $390,000 | 86% | 81 |
| 33 Old Academy Rd. | Colonial | 4,146 | 5 | 3/1 | $1,395,000 | $1,195,000 | $1,125,000 | 81% | 64 |
| 105 Chelsea St. | Colonial | 3,800 | 4 | 2/1 | $1,199,000 | $1,199,000 | $1,137,500 | 95% | 37 |
| Units Sold: 46 | $749,000 | $719,000 | $695,000 | 93% | 82 |
Sales Trends: January-December
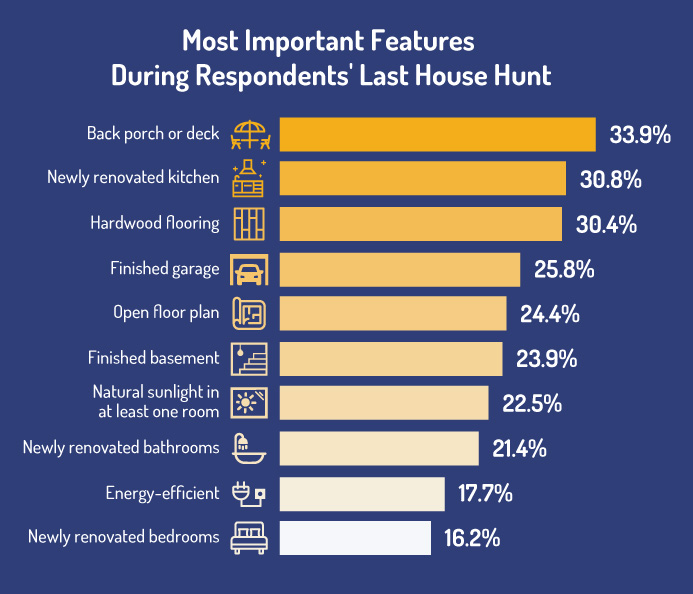
Most In-Demand Home Features:
Curious about which home features are most important to buyers? A recent survey by Porch.com reveals that the number 1 most sought-after home feature amongst buyers is a back porch or deck. Close 2nd and 3rd were a newly renovated kitchen and hardwood flooring. The ever-popular open-floor plan came in at a surprisingly 5th on the list trailing behind a finished garage. Other desired features included a finished basement, natural light, newly renovated bathrooms, energy efficiency and newly renovated bedrooms. The back porch or deck was the number one feature for baby boomers, generation x and millennials alike. On average, buyers were willing to pay between an additional $2,532 – $4,570 more than their budget for homes with the features they most desired.