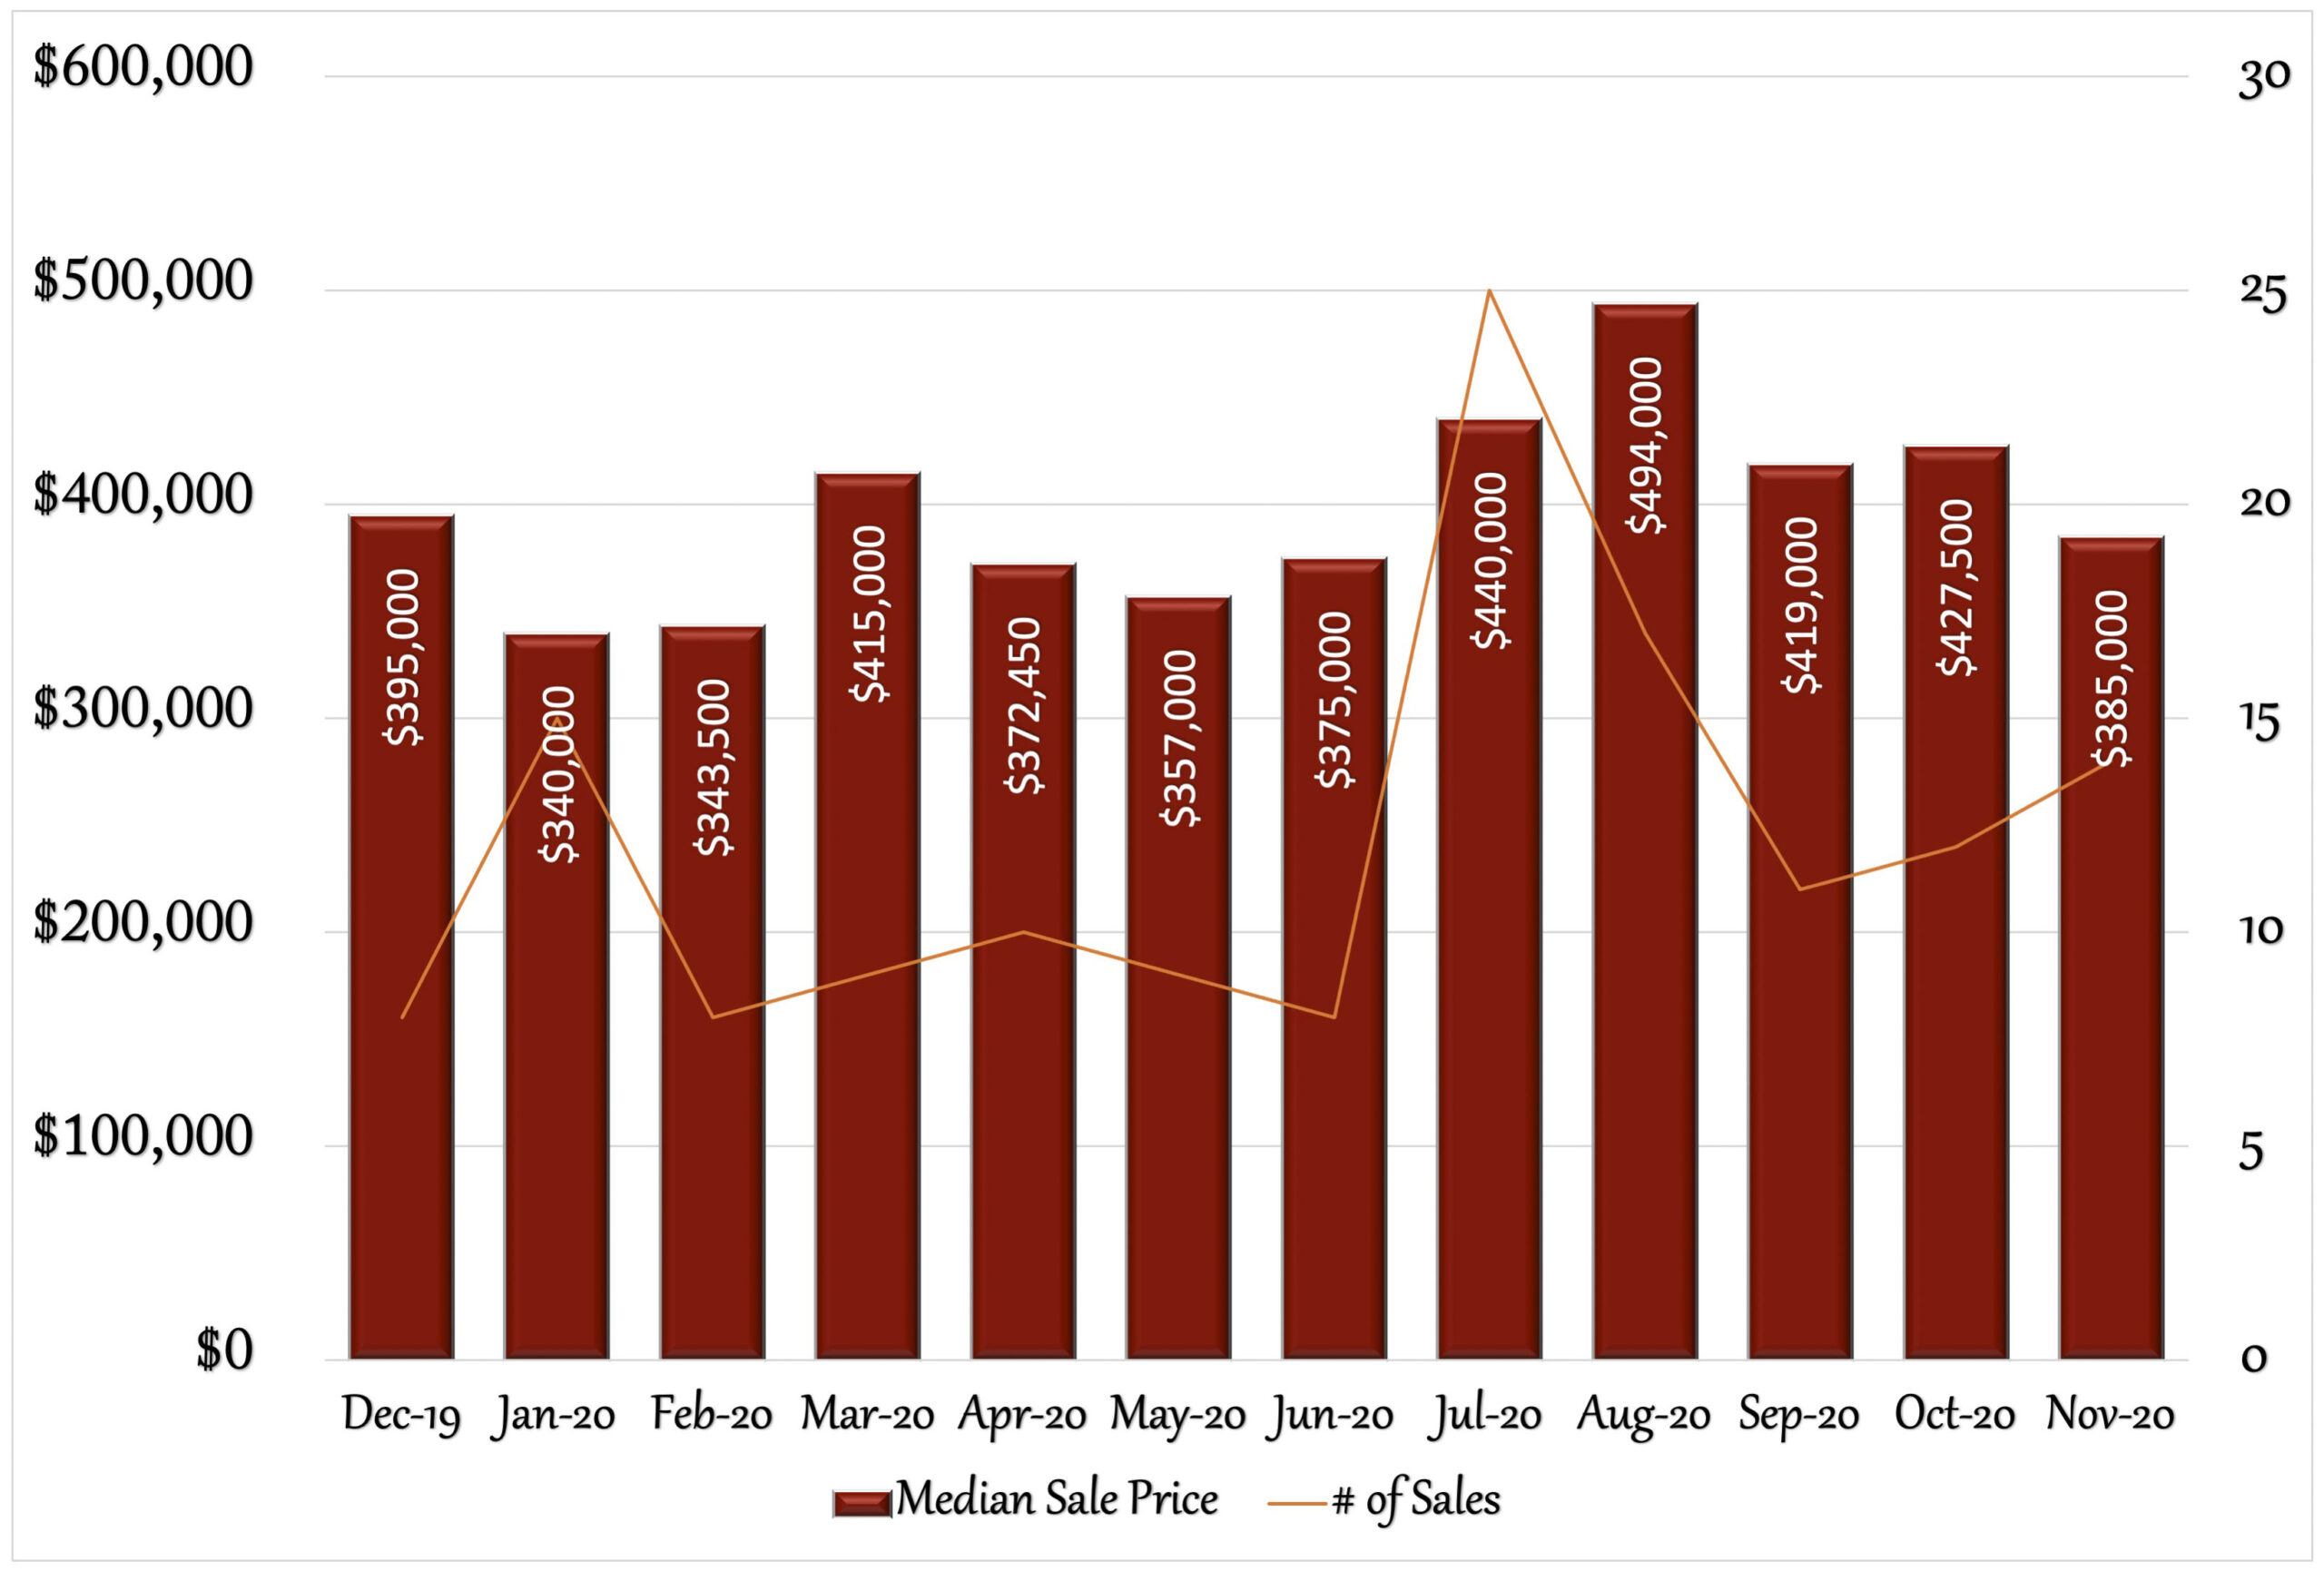
The real estate market in Orange saw a contraction in November when compared to the previous month, but still remains strong for the year. The median sales price dropped over 9% from $427,500 to $385,000 while the number of houses sold increased from 12 to 14. However, those houses sold in record breaking time, as the days on market was just 24 days. For the year, the median sales price is up over 13% so far. Even though the median sales price was lower in November, Orange still continues to be in a strong sellers-market, as low inventory and strong buyer demand are still being experienced. This long running sellers-market is expected to continue into 2021, as low interest rates continued to break records. The 30yr fixed rate was 2.71% by the end of November; the lowest rate ever recorded. This is still a great time to sell a home, and with such low interest rates, a good time to buy. Do you know anyone looking for more information about their real estate market? I’d be happy to help.
12 Month Sales Activity
Housing Stats
(change from previous month)
| Median Sale Price: | $385,000 |
| change: | -9.94% |
| YTD change: | 13.24% |
| Units Sold: | 14 |
| change: | 16.67% |
| Active Listings: | 39 |
| change: | -25.00% |
| New Listings: | 15 |
| change: | -28.57% |
| Days on Market: | 24 |
| change: | -47.83% |
| Months of Supply: | 3.30 (Seller's Market) |
| change: | -8.33% |

Economic News:
Stock Market: November saw all three major US markets rise sharply, as investors were encouraged with the news of two coronavirus vaccines showing favorable trial results, even while new cases continued to rise. The NASDEQ was up11.9%, S&P 500 up 10.75% and the Dow Jones was up 11.84%.
Employment: Employment rose by 245,000 jobs in November, and the unemployment rate lowered slightly to 6.7%, according to the U.S. Bureau of Labor Statistics. These improvements in the labor market reflect the continued resumption of economic activity that had been curtailed due to the coronavirus (COVID-19) pandemic and efforts to contain it. In November, notable job gains occurred in transportation and warehousing, professional and business services, and health care, while employment declined in government and retail trade.
Real Estate: According to realtor.com’s 2021 housing forcast, the current seller’s market is likely to continue. Low inventory and interest rates combined with strong buyer competition will continue to drive prices upwards. Buyers will suffer from low inventory, as higher prices will erase gains ofset by low interest rates, challenging affordability.
2020 Local Real Estate Price Trends:
November was another great month for home sales prices. Year-to-date median sales prices continued to be on the rise for most local towns when compared to 2019’s first 11 months. All towns show increases in median sales price, with many over 10%.
| 1/19-11/19 | 1/20-11/20 | Change | |
| Bethel | $345,000 | $386,550 | 12.04% |
| Bridgeport | $204,000 | $240,000 | 17.65% |
| Easton | $562,500 | $579,000 | 2.93% |
| Fairfield | $580,000 | $665,000 | 14.66% |
| Milford | $305,000 | $350,000 | 14.75% |
| Monroe | $362,500 | $412,500 | 13.79% |
| Newtown | $380,100 | $430,000 | 13.13% |
| Norwalk | $485,128 | $535,000 | 10.28% |
| Orange | $375,000 | $385,500 | 2.80% |
| Redding | $527,000 | $560,500 | 6.36% |
| Ridgefield | $628,250 | $699,000 | 11.26% |
| Shelton | $339,000 | $377,000 | 11.21% |
| Stratford | $250,000 | $291,000 | 16.40% |
| Trumbull | $385,000 | $430,000 | 11.69% |
| Weston | $685,000 | $805,000 | 17.52% |
| Westport | $1,142,857 | $1,341,000 | 17.34% |
| Wilton | $697,500 | $800,500 | 14.77% |
Improvements for First Time Homeowners:


Prices For Fences On The Rise:
With the pandemic, homeowners are seeking more privacy and security. The demand for fences has driven up prices. Since the begining of 2020, the price for pressure treated wood as more than doubled.
Orange Sales Trends: January-November
November Single-Family Home Sales
(OLP: original list price • LP: list price • SP: sale price • DOM: days on market)
| Address | Style | sq ft | BR | BA (f/h) | OLP | LP | SP | SP/OLP | DOM |
| 637 High Ridge Rd | Contemporary | 1,924 | 3 | 2/1 | $389,900 | $389,900 | $389,900 | 100% | 70 |
| 973 Cow Path Rd | Ranch | 1,664 | 3 | 2/0 | $349,000 | $349,000 | $385,000 | 110% | 22 |
| 400 Drummond Rd | Ranch | 2,146 | 3 | 2/0 | $449,000 | $449,000 | $505,000 | 112% | 1 |
| 311 Hotchkiss Rd | Ranch | 1,836 | 3 | 2/0 | $345,000 | $345,000 | $360,000 | 104% | 16 |
| 226 Sylvan Valley Rd | Cape Cod | 1,716 | 2 | 2/0 | $285,900 | $285,900 | $290,000 | 101% | 27 |
| 835 Woodruff Rd | Cape Cod | 2,348 | 3 | 2/0 | $320,000 | $320,000 | $322,500 | 101% | 15 |
| 318 Drummond Rd | Ranch | 1,324 | 3 | 1/0 | $348,500 | $348,500 | $341,000 | 98% | 59 |
| 136 Cricket Ln | Ranch | 1,616 | 3 | 2/0 | $364,900 | $364,900 | $386,000 | 106% | 2 |
| 424 Wildwood Dr | Colonial | 3,098 | 4 | 2/1 | $549,000 | $549,000 | $534,000 | 97% | 36 |
| 500 Ridgeview Rd | Ranch | 1,808 | 3 | 1/2 | $419,000 | $419,000 | $451,000 | 108% | 3 |
| 50 Rolling Ridge Rd | Ranch | 2,012 | 3 | 2/1 | $379,000 | $379,000 | $325,000 | 86% | 25 |
| 477 Howellton Rd | Ranch | 2,523 | 3 | 2/0 | $385,000 | $385,000 | $385,000 | 100% | 47 |
| 254 Midland Dr | Split Level | 1,604 | 4 | 1/1 | $349,900 | $349,900 | $360,000 | 103% | 41 |
| 48 Farm Hill Rd | Colonial | 4,314 | 4 | 3/1 | $875,000 | $875,000 | $875,000 | 100% | 5 |
| Units Sold: 14 | $371,950 | $371,950 | $385,000 | 101% | 24 |