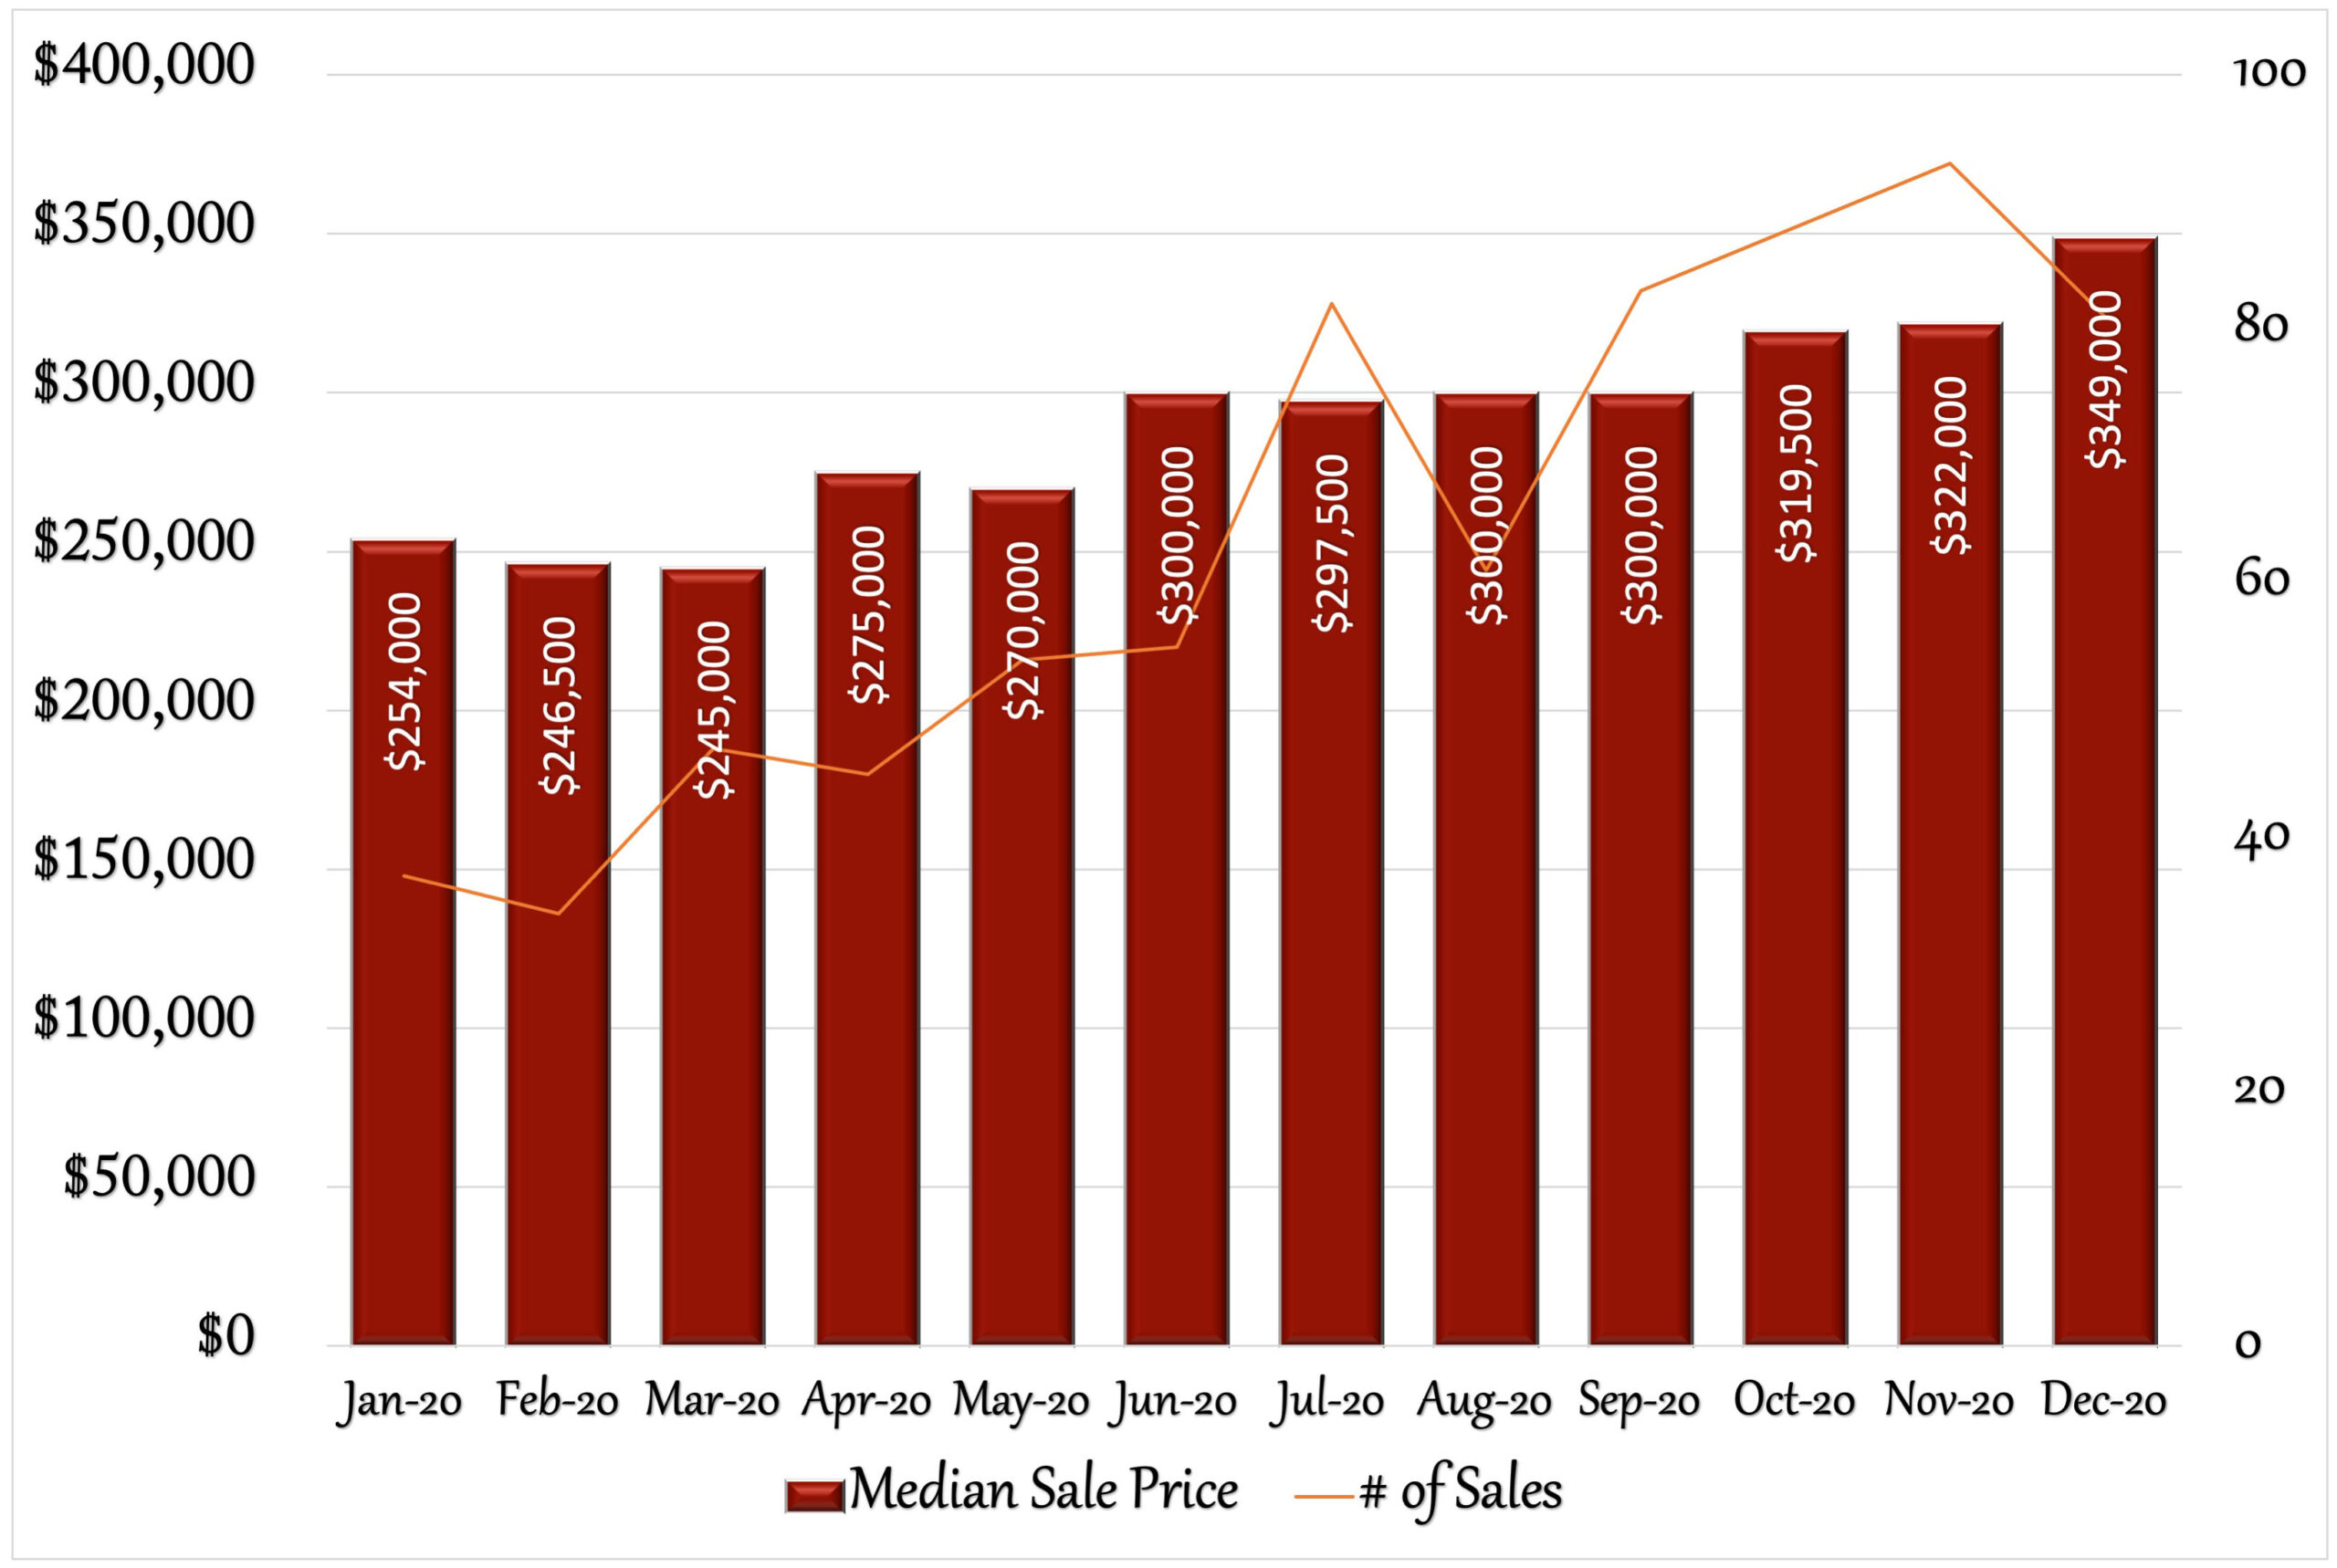
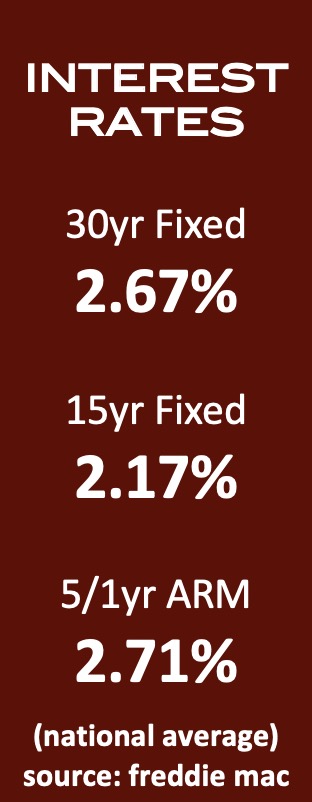
The real estate market in Stratford ended 2020 considerably stronger than it started. December’s median sales price for single family homes was an impressive 37.4% higher than in January: $349,000 vs. $254,000. And compared to 2019, home values saw a 19.96% increase in 2020. Stratford ended the year in a sellers-market, with 3.4 months of inventory, a trend that has been continuing for the past several years. Pandemic driven sales helped drive up demand as Stratford and most towns saw an increase in out of state buyers. Days on market were also low for the year, around 38 days for 2020 vs. 52 days for 2019, so houses were selling considerably quicker, with steep competition among buyers. Pandemic buying was strengthened by historically low interest rates. The 30yr fixed rate started the year at 4.51% and ended at 2.67%. This was a win-fall for buyers and many homeowners who were able to refinance higher rates, shortening their loan and saving hundreds of dollars in monthly interest moving forward. Although some reports suggest a slowdown of the urban exodus, inventory is still lower than demand and millennial buyers are expected to keep future sales strong. This is still a great time to sell. Do you know anyone looking for more information about their real estate market? I’d be happy to help.
12 Month Sales Activity
Housing Stats
(change from previous month)
| Median Sale Price: | $349,000 |
| change: | 8.39% |
| YTD change: | 37.40% |
| Units Sold: | 81 |
| change: | -12.90% |
| Active Listings: | 105 |
| change: | -29.53% |
| New Listings: | 41 |
| change: | -26.79% |
| Days on Market: | 42 |
| change: | 13.51% |
| Months of Supply: | 3.40 (Seller's Market) |
| change: | 41.67% |
2020 Local Real Estate Price Trends:
2020 turned out to be a stellar year for home value growth, which increased dramatically in nearly every town. The three big factors driving home prices for the year were pandemic driven buyers, historically low interest rates and an unusually low inventory of houses. Surprisingly, historic unemployment rates did not stop the surge in demand for CT houses. Even with 2020’s spectacular gains however, only Westport, Milford and Fairfield have seen home values return to levels prior to the great recession of 2009.
| 2019 | 2020 | Change | |
| Bethel | $345,000 | $388,750 | 12.68% |
| Bridgeport | $206,150 | $245,000 | 18.85% |
| Easton | $562,500 | $586,250 | 4.22% |
| Fairfield | $585,000 | $675,000 | 15.38% |
| Milford | $307,250 | $350,000 | 13.91% |
| Monroe | $367,500 | $425,000 | 15.65% |
| Newtown | $380,000 | $430,000 | 13.16% |
| Norwalk | $485,128 | $539,500 | 11.21% |
| Orange | $378,000 | $395,000 | 4.50% |
| Redding | $525,000 | $567,500 | 8.10% |
| Ridgefield | $628,250 | $700,000 | 11.42% |
| Shelton | $339,450 | $379,000 | 11.65% |
| Stratford | $250,000 | $299,900 | 19.96% |
| Trumbull | $385,000 | $430,000 | 11.69% |
| Weston | $685,000 | $819,000 | 19.56% |
| Westport | $1,125,000 | $1,355,499 | 20.49% |
| Wilton | $690,000 | $810,000 | 17.39% |
Gen X, Millennials Likely to Keep Home Buying Strong for Years to Come:
Between 2018 and 2028, the number of households is projected to increase by up to 12 million. Generation X and millennials are expected to drive most of that household formation. As they replace dropped households over that time, the two generations could add nearly 25 million new households by 2028, according to the CoreLogic Insights Blog.
The largest cohort of millennial buyers have yet to surface on the market, researchers note. That segment, from ages 28 to 30, numbers nearly 15 million and is approaching the average age to buy a first home, 33 years old, CoreLogic reports.
Even as younger generations wait to enter the housing market in high numbers, the market already faces a home inventory shortage. The number of homes for sale has reached the lowest level on record. That has prompted home prices to increase faster than incomes. Over the past two decades, home prices have increased by 1.6 times the rate of real household incomes, CoreLogic says.
Record low mortgage rates over the past few months have helped to offset high prices. Still, first-time home buyers are facing increasing affordability woes as they try to come up with a down payment. While the monthly mortgage payment and insurance have dropped by 3% compared to a year ago, the down payment needed is up 8% (from about $20,000 to about $22,000 for a median-priced home at $225,000), according to CoreLogic.
“This may be a daunting challenge for some particularly given that the median financial asset holding of families headed by a person under 35 years of age is only about $8,500,”
Exodus To The Suburbs Appears To Be Reversing:
The latest housing data shows consumers returning to urban areas after abandoning cities for the suburbs in the early days of the COVID-19 pandemic. In places such as New York, San Francisco, Chicago, and Boston, some rental buildings went from full occupancy to 50% vacant as remote work and school enabled residents to move to less congested areas.
But now there are signs of a reversal of that trend.
The Greater Boston Association of REALTORS® reports that sales of single-family homes and condos in the city were at their highest levels on record in October. In Chicago, home sales surged 39% the same month compared to a year ago, according to the Illinois Association of REALTORS®. In New York, single-family home sales jumped 34% from September to October.
But the appeal of big cities likely will return as the coronavirus vaccine rollout escalates, real estate experts predict. “I expect the big-city market to stay hot for a more gestalt reason: because city dwellers are city people,” Ryan Serhant, writes for Forbes.com. “City dwellers aren’t the type who want to live in rural areas, have only one or two local restaurants to choose from, and lose the electric energy that makes our cities such special places to be. Collectively, we are all looking ahead and looking forward to a return to pre-pandemic life.”With the pandemic, homeowners are seeking more privacy and security. The demand for fences has driven up prices. Since the begining of 2020, the price for pressure treated wood as more than doubled.
Stratford Sales Trends: January-December
December Single-Family Home Sales
(OLP: original list price • LP: list price • SP: sale price • DOM: days on market)
| Address | Style | sq ft | BR | BA (f/h) | OLP | LP | SP | SP/OLP | DOM |
| 548 Highland Ave | Ranch | 1,104 | 3 | 1/1 | $225,000 | $225,000 | $225,000 | 100% | 41 |
| 375 Housatonic Ave | Colonial | 1,738 | 3 | 1/1 | $299,900 | $299,900 | $315,000 | 105% | 66 |
| 5050 Main St | Contemporary, Modern | 7,580 | 5 | 4/1 | $1,600,000 | $1,600,000 | $1,550,000 | 97% | 165 |
| 911 Nichols Ave | Colonial | 1,396 | 2 | 1/1 | $259,900 | $259,900 | $280,000 | 108% | 4 |
| 60 Swanson Ave | Ranch | 870 | 2 | 1/0 | $214,500 | $200,000 | $205,000 | 96% | 57 |
| 47 Ridge Rd | Colonial | 1,428 | 3 | 1/0 | $299,000 | $299,000 | $314,000 | 105% | 79 |
| 205 Holmes St | Colonial | 2,022 | 3 | 2/0 | $284,900 | $329,900 | $360,000 | 126% | 103 |
| 1295 James Farm Rd | Raised Ranch | 3,189 | 5 | 4/0 | $579,900 | $565,000 | $540,000 | 93% | 45 |
| 161 Kenwood Ave | Cape Cod | 1,387 | 2 | 2/0 | $309,900 | $309,900 | $314,000 | 101% | 66 |
| 957 Huntington Rd | Colonial | 1,700 | 3 | 1/1 | $334,900 | $334,900 | $335,000 | 100% | 46 |
| 4185 Main St | Colonial | 1,966 | 4 | 1/1 | $344,900 | $344,900 | $357,000 | 104% | 65 |
| 65 Queens Ave | Cape Cod | 2,187 | 4 | 3/0 | $375,000 | $375,000 | $380,000 | 101% | 41 |
| 1a 3rd Ave | Colonial | 1,644 | 3 | 2/0 | $419,900 | $379,900 | $400,000 | 95% | 45 |
| 85 Nicki Laine Cir | Colonial | 3,190 | 3 | 2/1 | $459,000 | $479,000 | $459,000 | 100% | 54 |
| 20 Brinsmayd Ave | Ranch | 3,314 | 4 | 4/1 | $625,000 | $625,000 | $625,000 | 100% | 2 |
| 576 Huntington Rd | Colonial | 1,800 | 3 | 3/0 | $390,000 | $390,000 | $403,000 | 103% | 4 |
| 316 Booth St | Cape Cod | 1,346 | 2 | 2/0 | $229,900 | $229,900 | $225,000 | 98% | 73 |
| 350 Swanson Ave | Cape Cod | 1,376 | 4 | 1/1 | $259,900 | $259,900 | $263,000 | 101% | 31 |
| 264 Freeman Ave | Colonial | 1,396 | 3 | 1/1 | $359,900 | $359,900 | $381,000 | 106% | 2 |
| 135 Brookbend Dr | Cape Cod | 1,566 | 3 | 1/1 | $279,900 | $279,900 | $285,000 | 102% | 64 |
| 96 Allencrest Dr | Cape Cod | 1,884 | 4 | 2/0 | $329,900 | $339,900 | $348,000 | 105% | 42 |
| 65 Bear Paw Rd | Raised Ranch | 2,012 | 3 | 2/1 | $389,900 | $389,900 | $385,000 | 99% | 2 |
| 151 Broadmere Rd | Cape Cod | 1,120 | 4 | 1/0 | $249,000 | $235,000 | $230,000 | 92% | 66 |
| 886 Riverton Ter | Colonial | 1,534 | 3 | 1/0 | $244,900 | $244,900 | $267,000 | 109% | 65 |
| 25 Meadowbrook Rd | Cape Cod | 1,346 | 3 | 2/0 | $319,000 | $309,000 | $309,000 | 97% | 36 |
| 55 Queens Ave | Colonial | 1,484 | 3 | 1/1 | $309,900 | $309,900 | $330,000 | 106% | 30 |
| 815 Huntington Rd | Ranch | 2,184 | 3 | 2/0 | $339,900 | $339,900 | $335,000 | 99% | 28 |
| 20 Hitching Post Ln | Ranch | 1,734 | 3 | 3/0 | $349,000 | $349,000 | $349,000 | 100% | 66 |
| 128 Castle Dr | Cape Cod, Colonial | 2,264 | 4 | 2/0 | $339,900 | $339,900 | $355,000 | 104% | 49 |
| 18 Winfield Dr | Colonial | 2,004 | 3 | 3/1 | $425,000 | $425,000 | $425,000 | 100% | 110 |
| 556 Bridgeview Pl | Cape Cod | 2,150 | 3 | 2/0 | $440,000 | $440,000 | $485,000 | 110% | 42 |
| 770 James Farm Rd | Colonial | 2,440 | 4 | 3/0 | $499,900 | $499,900 | $505,555 | 101% | 39 |
| 106 General St | Cape Cod | 1,328 | 4 | 1/0 | $150,000 | $150,000 | $162,000 | 108% | 10 |
| 204 King St | Cape Cod | 1,081 | 3 | 2/0 | $245,000 | $245,000 | $250,000 | 102% | 49 |
| 30 Monroe St | Colonial | 1,852 | 3 | 2/0 | $329,900 | $299,000 | $320,000 | 97% | 11 |
| 535 Wilcoxson Ave | Colonial | 2,040 | 4 | 1/1 | $324,900 | $324,900 | $350,000 | 108% | 36 |
| 50 Hortense St | Colonial | 1,480 | 3 | 1/1 | $365,000 | $365,000 | $370,000 | 101% | 66 |
| 43 Vermont Ave | Cape Cod | 1,912 | 3 | 3/0 | $539,000 | $589,000 | $570,000 | 106% | 58 |
| 67 Van Rensselaer Ave | Colonial | 1,370 | 3 | 1/0 | $195,000 | $195,000 | $200,000 | 103% | 73 |
| 490 Emerald Pl | Cape Cod | 3,116 | 3 | 2/1 | $369,000 | $369,000 | $369,000 | 100% | 59 |
| 830 Wigwam Ln | Ranch | 1,492 | 3 | 2/0 | $349,900 | $349,900 | $370,000 | 106% | 3 |
| 3911 Main St | Colonial | 2,500 | 5 | 3/1 | $429,900 | $429,900 | $429,900 | 100% | 136 |
| 335 Wakelee Ave | Cape Cod | 1,154 | 3 | 1/0 | $289,000 | $289,000 | $298,000 | 103% | 4 |
| 962 Wells Pl | Colonial | 2,775 | 5 | 3/0 | $374,962 | $374,962 | $392,200 | 105% | 4 |
| 49 Terry Pl | Colonial | 1,724 | 4 | 3/0 | $399,900 | $399,900 | $430,000 | 108% | 3 |
| 118 Emerson Dr | Colonial | 2,314 | 4 | 2/1 | $395,000 | $395,000 | $436,500 | 111% | 26 |
| 175 Harding Ave | Half Duplex | 1,200 | 3 | 1/1 | $149,900 | $149,900 | $145,000 | 97% | 39 |
| 35 Early Ave | Ranch | 2,080 | 3 | 1/0 | $229,900 | $229,900 | $229,900 | 100% | 13 |
| 246 Garibaldi Ave | Cape Cod | 1,252 | 4 | 2/0 | $259,900 | $259,900 | $270,000 | 104% | 6 |
| 280 Booth St | Colonial | 2,412 | 4 | 2/1 | $364,500 | $364,500 | $365,000 | 100% | 22 |
| 59 Elk Ter | Colonial | 1,861 | 3 | 2/1 | $419,900 | $424,900 | $440,000 | 105% | 83 |
| 401 Ocean Ave | Colonial | 7,416 | 5 | 4/1 | $2,399,000 | $2,399,000 | $2,325,000 | 97% | 131 |
| 91 Woodland Ave | Ranch | 1,181 | 3 | 2/0 | $259,750 | $235,000 | $230,000 | 89% | 56 |
| 231 Swanson Ave | Cape Cod | 1,238 | 3 | 1/0 | $249,900 | $249,900 | $267,000 | 107% | 19 |
| 93 Brewster St | Cape Cod | 2,594 | 3 | 2/0 | $375,000 | $375,000 | $405,250 | 108% | 7 |
| 11 Linksview Pl | Ranch | 2,078 | 3 | 2/0 | $449,000 | $449,000 | $425,000 | 95% | 30 |
| 45 Nicki Laine Cir | Colonial | 3,190 | 3 | 2/1 | $459,000 | $459,000 | $460,000 | 100% | 64 |
| 70 Deepwood Rd | Colonial | 2,625 | 4 | 2/1 | $479,900 | $479,900 | $475,000 | 99% | 36 |
| 117 Yarwood St | Ranch | 1,244 | 3 | 2/0 | $319,600 | $319,600 | $315,000 | 99% | 55 |
| 34 Wood Ave | Cape Cod | 1,418 | 3 | 2/0 | $319,000 | $319,000 | $328,800 | 103% | 24 |
| 315 Oak Ridge Rd | Split Level | 2,309 | 4 | 2/1 | $359,900 | $359,900 | $370,000 | 103% | 5 |
| 20 Bunnyview Dr | Colonial | 2,504 | 3 | 2/1 | $419,000 | $419,000 | $426,000 | 102% | 21 |
| 534 Columbus Ave | Half Duplex | 984 | 2 | 1/0 | $139,000 | $139,000 | $140,000 | 101% | 57 |
| 60 Pootatuck Path | Ranch | 2,290 | 4 | 2/2 | $375,000 | $375,000 | $395,000 | 105% | 65 |
| 1964 Broadbridge Ave | Cape Cod | 1,418 | 3 | 1/0 | $264,900 | $264,900 | $267,000 | 101% | 5 |
| 185 Lantern Rd | Colonial | 2,500 | 4 | 2/1 | $499,900 | $499,900 | $485,000 | 97% | 71 |
| 67 Swanson Ave | Cape Cod | 1,577 | 3 | 1/1 | $259,900 | $259,900 | $259,900 | 100% | 38 |
| 435 Nichols Ave | Colonial | 1,517 | 3 | 2/0 | $295,000 | $295,000 | $320,000 | 108% | 51 |
| 295 Hollywood Ave | Split Level | 1,517 | 3 | 2/0 | $319,900 | $319,900 | $340,000 | 106% | 55 |
| 55 Paradise Ct | Colonial, Raised Ranch | 1,456 | 4 | 3/0 | $389,000 | $389,000 | $389,000 | 100% | 68 |
| 200 Harding Ave | Cape Cod | 1,764 | 3 | 2/0 | $290,000 | $275,000 | $270,000 | 93% | 34 |
| 410 Carol Rd | Ranch | 1,515 | 3 | 1/0 | $259,000 | $259,000 | $285,000 | 110% | 67 |
| 155 Lincoln St | Colonial | 1,260 | 3 | 1/1 | $319,000 | $319,000 | $319,000 | 100% | 32 |
| 188 Sultan St | Colonial | 1,582 | 3 | 1/1 | $374,999 | $374,999 | $380,000 | 101% | 48 |
| 6 3rd Ave, Unit #6 | Ranch | 600 | 1 | 1/0 | $245,000 | $235,000 | $235,000 | 96% | 30 |
| 400 Maple Oak Dr, Unit #400 | Colonial | 2,058 | 3 | 2/1 | $434,000 | $429,000 | $420,000 | 97% | 75 |
| 140 Gem St | Split Level | 1,580 | 3 | 1/1 | $319,500 | $299,990 | $300,000 | 94% | 40 |
| 400 N. Abram St | Cape Cod | 1,287 | 4 | 2/0 | $310,000 | $310,000 | $317,000 | 102% | 4 |
| 89 Van St | Colonial | 1,476 | 3 | 1/1 | $339,000 | $339,000 | $340,000 | 100% | 20 |
| 107 Cedar Knoll Dr | Split Level | 1,650 | 3 | 1/1 | $349,900 | $359,900 | $365,000 | 104% | 64 |
| 1625 James Farm Rd | Colonial | 2,080 | 4 | 2/1 | $419,900 | $419,900 | $419,900 | 100% | 8 |
| Units Sold: 81 | $339,000 | $339,900 | $349,000 | 101% | 42 |