
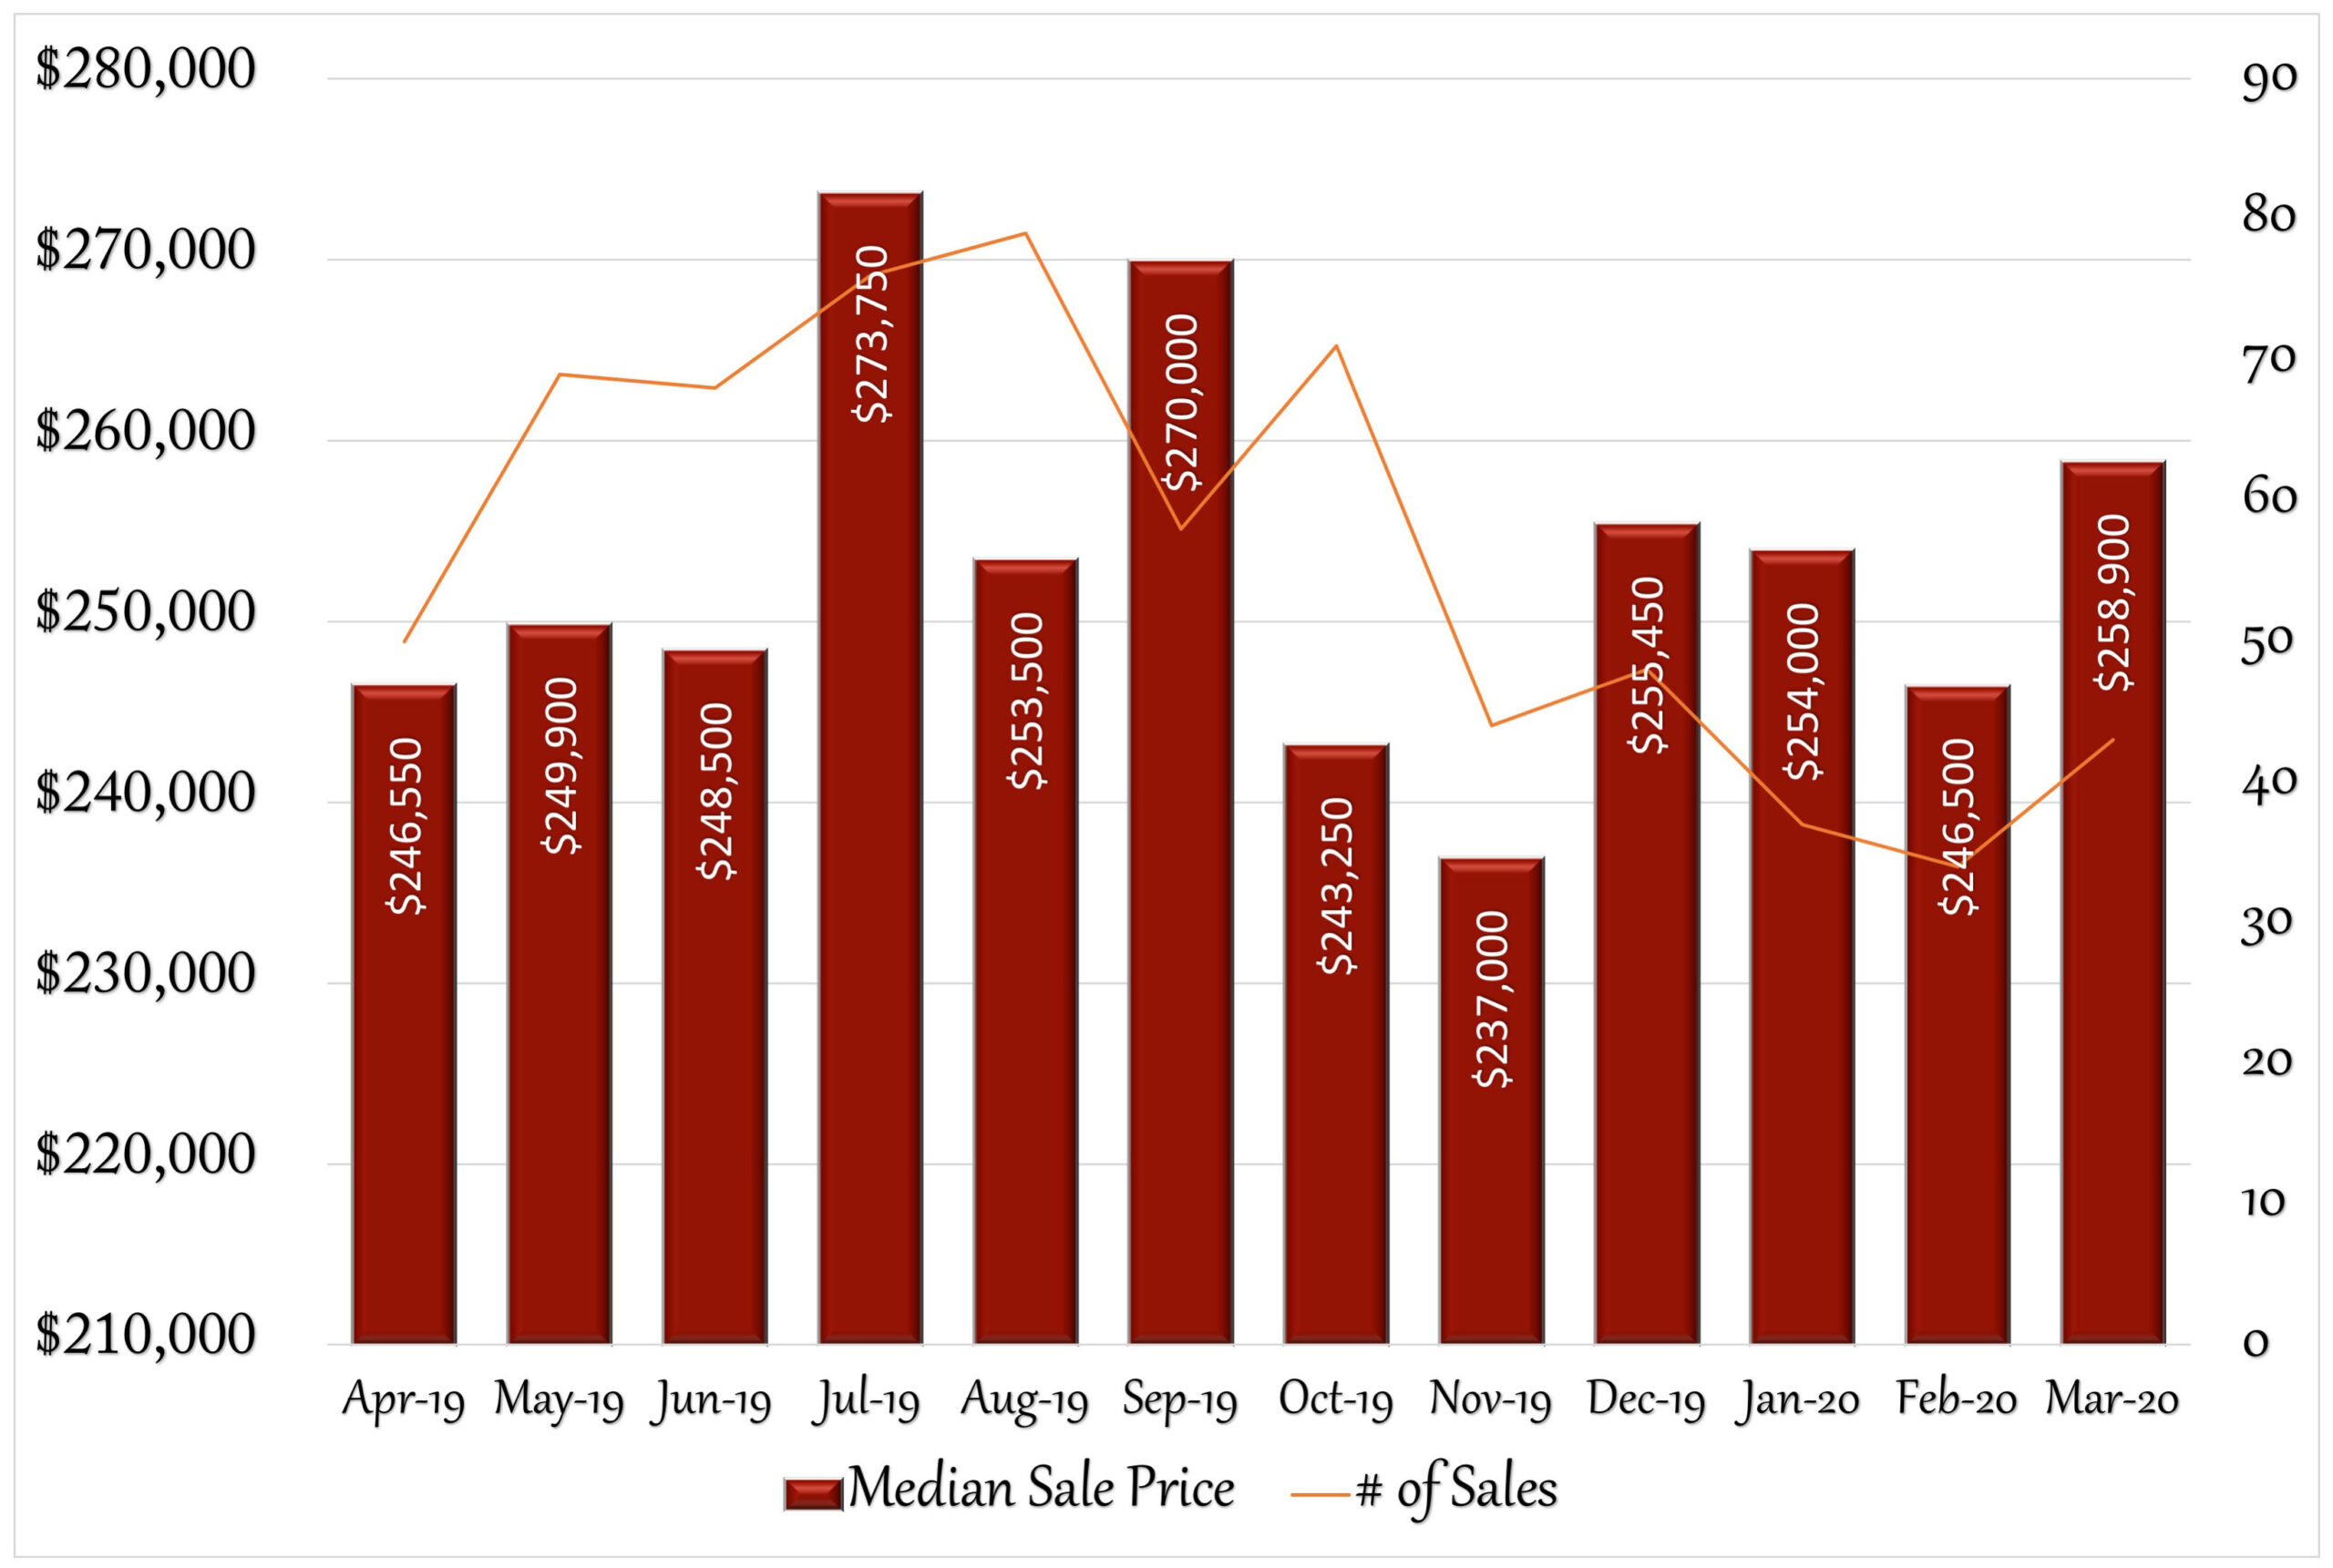
May turned out to be somewhat similar to April for the Stratford real estate market. The median sales price remained virtually unchanged, as did the number of pending sales (reflecting the number of accepted offers). Sellers started coming back into the market in May, as the number of new listings nearly doubled, however the number of homes for sale is down drastically from 1 year ago: 279 last May compared to 158 now. The homes for sale did sell well, as the days on market was at 37 days in May. There was also more competition among buyers, as the % of list price to sales price was 100% for the second month in a row and the number of showings per contract dropped from 17 to 13. Buyer demand will be something to watch for in June as sellers start to feel more comfortable listing their homes as coronavirus restrictions continue to ease. Interest rates continue to break all time low records; 3.15% at the end of May. Combined with more people returning to work, interest in Stratford should continue to be strong. Do you know anyone looking for more information about their real estate market? I’d be happy to help.
12 Month Sales Activity
Housing Stats
(change from previous month)
| Median Sale Price: | $274,950 |
| change: | -0.02% |
| YTD change: | 17.00% |
| Units Sold: | 52 |
| change: | 15.56% |
| Active Listings: | 158 |
| change: | 1.28% |
| New Listings: | 70 |
| change: | 84.21% |
| Days on Market: | 37 |
| change: | -5.13% |
| Months of Supply: | 2.90 (Seller's Market) |
| change: | 3.57% |

Stock Market: From its record highs in mid-February and early March, the stock market experienced shattering declines of more than 20% by March 23rd. Since then, despite record unemployment and a nationwide economic standstill, the markets have recovered nearly 75% of its losses by the end of May.
Unemployment: While weekly filings of unemployment claims since the start of the coronavirus outbreak have slowed, by the end of May, the total number of unemployed had reached 42 million Americans. Even while people are starting to get back to work, an additional 1.9 million people filed for unemployment in the last week of May. Unemployment numbers are expected to drop sharply June as more businesses re-open.
Real Estate: There has been a nationwide boom of home purchases during the coronavirus economic downturn. By the end of May, mortgage applications for new home purchases were up 17.5% from a year ago. Sales prices were up 3.9%. While millions of Americans have lost their jobs, those able to work from home have been buying in record numbers.
Rising Share Of First-Time Buyers As Investor Buyers Retreat: First time homebuyers are jumping into the market while investors became more cautious.
Decline In Sales In Urban Areas And Condominiums: Share of homes sold in the urban area or central city dropped further than rural areas, and condominium sales dropped steeper than single family sales dropped.
Increasing Use Of Virtual Tours/Showings/Open Houses: Social distancing measures resulted in fewer in-person client showings and an increase in virtual tours and open houses.
Rise In Contract Cancellations Related To Job Loss: The termination of homes under contract have risen due to job loss or other corona virus related issues.
Prices Remain Firm And Listings Are Starting To Revover: Listing prices have remained steady as sellers have been in no rush to sell homes at a lower price. Record low interest rates have kept buyers in the market.
During this time of social distancing, homeowners who are waiting to list can use the time to make a big difference in their home with upgrades that don’t have to cost a fortune. Simple DIY projects can enhance a home and make spaces more appealing for buyers when homeowners are ready to move forward with their home sale. These are classics, and they still provide low cost, high impact value:
Lighting: Consider changing old lighting styles with modern/classic fixtures. Glass pendant lights in the kitchen make a big impact. Blown glass and geometric shaped pendants are becoming popular.
Paint: Still one of the simplest and least expensive DIY projects that has a dramatic impact on the homes appeal to buyers. Some popular colors for 2020 include Sherwin Williams Naval, Pantone Classic Blue, Behr Back to Nature, Benjamin Moore First Light, Graham & Brown Adeline, Dunn-Edwards Minty Fresh…
Curb Appeal: New flowers, fresh mulch and trimmed shrubs make a big difference. A well-designed front porch is also popular.
Smart Home Upgrades: Smart thermostats, smart switches and plugs, smart locks and energy monitoring systems are a big plus with buyers.
Cabinet and Doorknobs: Changing out old interior doorknobs to new ones that compliment other finishes in the home is an easy, inexpensive way to add a fresh look to the home. New cabinet hardware is also an inexpensive way to bring new life to an older kitchen.
If you have been thinking about selling, now could be the best time in months to put your house on the market. Because of coronavirus, many homeowners were reluctant to list their homes: fearful of infected strangers entering their home and a lack of desire to look for their next home for similar reason. This caused a lack of inventory and a stall to the Spring market. However, buyers are out there, and ready to take advantage of never seen before low interest rates. By the end of May, the 30-year fixed rate was 3.15%! We have have seen an increase in buyers from New York City wishing to leave behind the city crowds for a taste of what Connecticut living has to offer. Prices have remained steady, and in some towns increased. Days on market in most towns have decreased as has the # of showings to contract. The market is moving in the right direction for sellers, and buyers are getting great financing options to afford the house and lifestyle of their dreams. Safe showing options (such as virtual tours) are available. If you have been thinking of selling, talk to your Realtor of choice for more information.
Stratford Sales Trends: January-May

May Single-Family Home Sales
(OLP: original list price • LP: list price • SP: sale price • DOM: days on market)
| Address | Style | sq ft | BR | BA (f/h) | OLP | LP | SP | SP/OLP | DOM |
| 1270 North Ave. | Cape Cod | 1,160 | 3 | 1/0 | $180,000 | $180,000 | $181,000 | 101% | 32 |
| 1746 NORTH Ave. | Cape Cod, Colonial | 1,720 | 3 | 2/0 | $250,000 | $250,000 | $250,000 | 100% | 4 |
| 180 Blueberry Lane | Ranch | 2,090 | 4 | 2/1 | $319,900 | $319,900 | $295,000 | 92% | 101 |
| 221 Housatonic Ave. | Colonial | 1,490 | 4 | 2/0 | $309,900 | $309,900 | $309,900 | 100% | 39 |
| 1776 Huntington Rd. | Colonial | 3,113 | 3 | 2/1 | $415,000 | $399,900 | $400,000 | 96% | 22 |
| 282 Park Blvd. | Colonial | 2,723 | 5 | 3/0 | $722,000 | $699,000 | $675,000 | 93% | 32 |
| 25 York St. | Colonial | 2,426 | 4 | 2/1 | $849,900 | $849,900 | $800,000 | 94% | 15 |
| 3911 Main St. | Colonial | 2,047 | 4 | 1/0 | $220,000 | $200,000 | $190,000 | 86% | 8 |
| 220 York St. | Cape Cod | 1,506 | 3 | 1/0 | $369,900 | $369,900 | $345,000 | 93% | 49 |
| 50 Arbor St. | Cape Cod, Ranch | 968 | 2 | 1/0 | $239,900 | $239,900 | $242,050 | 101% | 6 |
| 111 Washington | Colonial | 3,500 | 4 | 3/2 | $599,900 | $599,900 | $560,000 | 93% | 145 |
| 9 Wooster Ave. | Half Duplex | 1,192 | 3 | 1/0 | $99,900 | $99,900 | $88,500 | 89% | 82 |
| 11 London Terrace | Colonial | 1,491 | 3 | 1/1 | $159,900 | $159,900 | $170,000 | 106% | 19 |
| 281 Henry Ave. | Colonial | 1,300 | 3 | 1/1 | $154,900 | $154,900 | $155,000 | 100% | 35 |
| 402 Soundview Ave. | Colonial | 2,192 | 3 | 2/1 | $219,900 | $209,900 | $220,000 | 100% | 67 |
| 35 Newtown Ave. | Cape Cod, Colonial | 1,312 | 3 | 1/1 | $279,900 | $279,900 | $279,900 | 100% | 62 |
| 20 Arthurs Court | Ranch | 3,904 | 3 | 3/0 | $324,900 | $324,900 | $318,000 | 98% | 40 |
| 174 Anson St. | Cape Cod | 1,389 | 3 | 2/0 | $325,000 | $325,000 | $325,000 | 100% | 18 |
| 1318 South Ave. | Colonial | 2,637 | 4 | 1/1 | $199,000 | $189,000 | $186,200 | 94% | 126 |
| 30 Ross Dr. | Ranch | 1,300 | 3 | 1/1 | $235,000 | $235,000 | $235,000 | 100% | 37 |
| 300 Harding Ave. | Cape Cod | 1,044 | 3 | 1/0 | $265,000 | $250,000 | $250,000 | 94% | 44 |
| 125 Alvord St. | Raised Ranch | 2,300 | 4 | 3/0 | $429,000 | $429,000 | $429,000 | 100% | 53 |
| 435 Columbus Ave. | Half Duplex | 1,040 | 2 | 1/0 | $149,900 | $149,900 | $149,900 | 100% | 13 |
| 343 Soundview Ave. | Cape Cod | 1,324 | 3 | 1/0 | $239,900 | $239,900 | $221,000 | 92% | 78 |
| 433 Crown St. | Cape Cod | 1,481 | 3 | 2/0 | $310,000 | $310,000 | $318,000 | 103% | 35 |
| 240 Brookbend Dr. | Raised Ranch | 1,924 | 3 | 1/1 | $349,900 | $339,900 | $335,000 | 96% | 59 |
| 312 Rockwell Ave. | Colonial | 2,290 | 3 | 2/1 | $349,900 | $349,900 | $350,000 | 100% | 35 |
| 60 Birch Place | Colonial | 2,400 | 3 | 2/1 | $424,900 | $399,900 | $396,000 | 93% | 80 |
| 956 Huntington Rd. | Ranch | 1,077 | 2 | 1/0 | $175,000 | $175,000 | $186,000 | 106% | 13 |
| 55 Woodcrest Ave. | Ranch | 1,074 | 3 | 1/0 | $269,900 | $259,900 | $259,900 | 96% | 16 |
| 695 Connors Lane | Ranch | 1,392 | 3 | 1/0 | $259,900 | $259,900 | $270,000 | 104% | 19 |
| 215 Orchard Hill Dr. | Cape Cod | 2,482 | 3 | 2/0 | $299,900 | $299,900 | $303,000 | 101% | 66 |
| 125 Jefferson St. | Cape Cod | 1,462 | 2 | 2/0 | $367,500 | $367,500 | $360,000 | 98% | 67 |
| 305 Fairfax Dr. | Ranch | 1,827 | 4 | 2/0 | $399,900 | $399,900 | $399,900 | 100% | 6 |
| 1110 Beaver Dam Rd. | Colonial | 4,598 | 5 | 3/1 | $569,000 | $519,900 | $515,000 | 91% | 133 |
| 325 Mckinley Ave. | Half Duplex | 992 | 2 | 1/0 | $58,300 | $58,300 | $87,150 | 149% | 14 |
| 405 Carol Rd. | Ranch | 1,229 | 3 | 1/0 | $264,900 | $239,900 | $239,900 | 91% | 84 |
| 215 Columbus Ave. | Cape Cod | 1,285 | 3 | 2/0 | $274,900 | $269,000 | $262,000 | 95% | 58 |
| 310 Oceanview Terrace | Ranch | 1,942 | 3 | 1/1 | $288,000 | $288,000 | $288,000 | 100% | 37 |
| 100 Silver Lane | Ranch, Hi-Ranch | 1,964 | 3 | 2/0 | $310,000 | $310,000 | $310,000 | 100% | 38 |
| 476 2nd Ave. | Cape Cod | 1,695 | 4 | 2/0 | $429,000 | $429,000 | $410,000 | 96% | 96 |
| 152 Woodcrest Ave. | Cape Cod | 1,317 | 3 | 1/0 | $179,900 | $179,900 | $186,000 | 103% | 3 |
| 11 Edison St. | Cape Cod | 1,318 | 3 | 1/0 | $245,900 | $245,900 | $250,000 | 102% | 41 |
| 935 James Farm Rd. | Cape Cod | 3,039 | 5 | 3/0 | $299,900 | $299,900 | $287,900 | 96% | 6 |
| 114 4th Ave. | Ranch | 1,176 | 3 | 1/1 | $299,900 | $299,900 | $308,000 | 103% | 37 |
| 4221 Main St. | Cape Cod | 2,263 | 3 | 2/1 | $355,000 | $355,000 | $367,000 | 103% | 1 |
| 125 Wood Ave. | Colonial | 1,356 | 3 | 1/1 | $239,000 | $239,000 | $239,000 | 100% | 1 |
| 229 Glenfield Ave. | Ranch | 1,104 | 3 | 1/1 | $259,900 | $259,900 | $263,000 | 101% | 26 |
| 85 Clements Dr. | Ranch | 1,288 | 3 | 1/0 | $262,900 | $262,900 | $265,000 | 101% | 12 |
| 490 Bunnyview Dr. | Ranch | 1,240 | 2 | 1/0 | $259,900 | $259,900 | $270,000 | 104% | 4 |
| 970 Longbrook Ave. | Cape Cod | 1,980 | 3 | 1/1 | $271,000 | $267,500 | $270,000 | 100% | 108 |
| 305 Sunnybank Ave. | Split Level | 1,617 | 3 | 2/0 | $309,900 | $304,900 | $302,000 | 97% | 147 |
| Units Sold: 52 | $277,400 | $274,450 | $274,950 | 100% | 37 |