Serving New Haven and Fairfield Counties | Contact: (203) 895-2783
Menu
Menu
Stratford Market Report March 2021
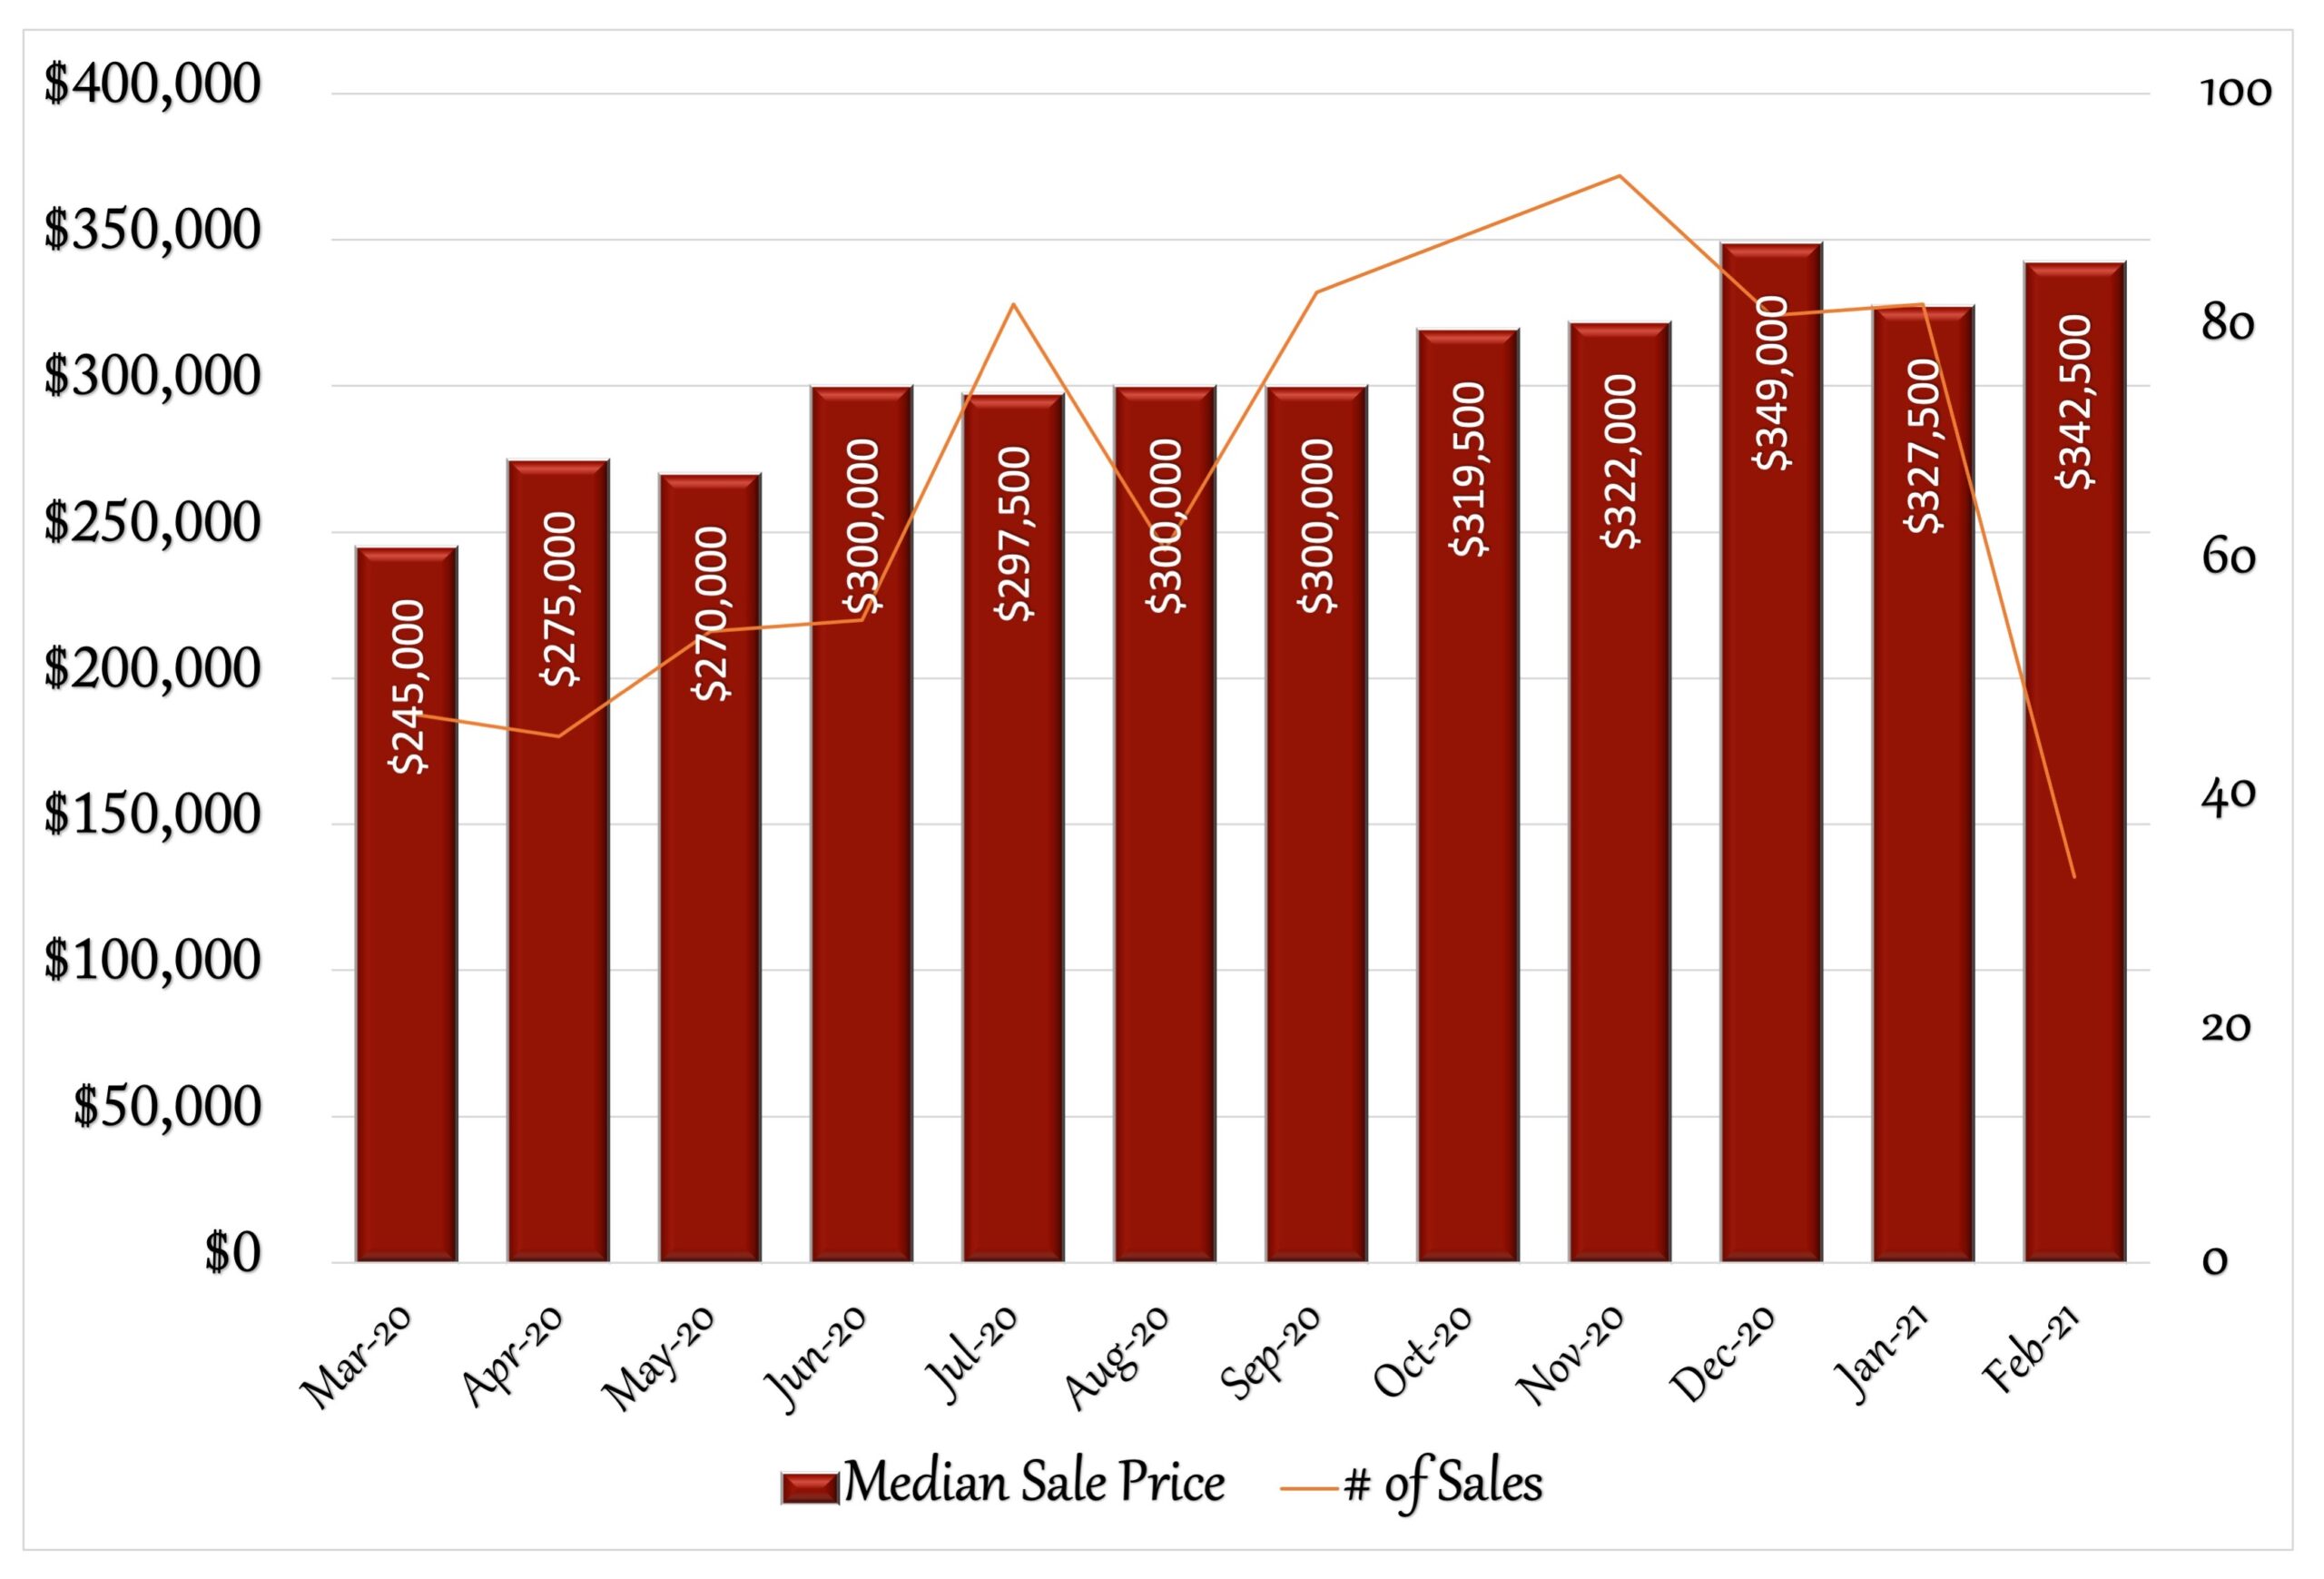
Stratford’s housing market continued to be strong in February. The median sales price for single family homes increased over 4% from $327,500 in January to $342,500 in February. In the past 12 months, the highest median sales price month was December 2020 at $349,000, with February 2021 a close second. Year over year, 2021 is starting out high, with a median sales price of $335,000, which is the highest since the pre-great recession price of $315,000 reached in 2005. Real estate activity was mixed in February, as the number of houses sold dropped from 82 in January to 33 in February, although the number of new listings increased from 44 to 52 and the time it took to sell houses dropped; from 41 to 36 days. Inventory continues to be low with only 81 houses for sale in February. Compare that to a year ago with 146 houses on the market. With this brisk activity, Stratford continues to be a strong sellers-market with only 1.3 months of housing supply available (6 months is considered a stable market between buyers and sellers). Interest rates have been on the rise the last two months. By the end of February, the 30yr fixed rate was 3.02%, a 10% increase from the previous month. However, rates still continue to be at historic low levels, and buyers are looking to buy homes at these great rates, frustrated by the lack of inventory. This is still an excellent time to sell. Do you know anyone looking for more information about their real estate market? I’d be happy to help.
12 Month Sales Activity
Housing Stats
(change from previous month)
| Median Sale Price: | $342,500 |
| change: | 4.58% |
| YTD change: | 4.58% |
| Units Sold: | 33 |
| change: | -59.76% |
| Active Listings: | 81 |
| change: | -6.90% |
| New Listings: | 52 |
| change: | 18.18% |
| Days on Market: | 36 |
| change: | -12.20% |
| Months of Supply: | 1.30 (Seller's Market) |
| change: | -7.14% |
Interest Rates

Local Median Sales Price Trends:
| Jan-21 | Feb-21 | Change | |
| Bethel | $527,473 | $430,000 | -18.48% |
| Bridgeport | $268,500 | $250,000 | -6.89% |
| Brookfield | $550,000 | $432,500 | -21.36% |
| Danbury | $367,500 | $357,000 | -2.86% |
| Easton | $675,000 | $612,125 | -9.31% |
| Fairfield | $692,000 | $679,500 | -1.81% |
| Milford | $345,000 | $408,000 | 18.26% |
| Monroe | $434,000 | $430,000 | -0.92% |
| Newtown | $450,000 | $465,000 | 3.33% |
| Orange | $394,900 | $386,000 | -2.25% |
| Oxford | $465,000 | $373,250 | -19.73% |
| Redding | $477,500 | $702,500 | 47.12% |
| Seymour | $270,000 | $268,000 | -0.74% |
| Shelton | $393,000 | $370,000 | -5.85% |
| Stratford | $327,500 | $342,500 | 4.58% |
| Trumbull | $485,000 | $450,000 | -7.22% |
| Weston | $810,000 | $1,212,000 | 49.63% |
| Westport | $1,555,000 | $1,600,000 | 2.89% |
| Wilton | $870,000 | $705,000 | -18.97% |
Real Estate Headlines:
Most Popular Markets for Gen X Home Buyers: Generation X, those born between 1965 and 1980—are in their peak earning years, and increasingly turning to real estate. They often make up more than a quarter of home buyers in the nation’s largest metros, just behind millennials. The top 10 metro areas for Gen X buyers in 2020 were Memphis, TN, Jacksonville, FL, Atlanta, GA, Washington, DC, Orlando FL, Miami, FL, New Orleans, LA, Baltimore, MD, Tampa, FL and Raleigh, NC.
10 Fastest-Growing Retirement Towns: About 28.6 million baby boomers retired in the third quarter of 2020 alone, according to Pew Research Center data. That has prompted a growing number of new retirees to seek out the perfect place to ride out their golden years in retirement—and Florida isn’t the only place they’re targeting. Retirees might be able to cash out pretty significant equity in their homes and find something more affordable, or maybe find something better for the same price in a location that’s generally more affordable. They’re also relocating to be closer to their adult children or their grandchildren. According to Realtor.com research collected between 2014 and 2019, the ten fastest-growing retirement destinations (with median home list price) are: Lakeland, FL ($260,050), Traverse City, MI ($419,950), Springfield, MA ($300,050), Coeur d’Alene, ID (850,050), Wilmington, NC ($382,550), Winchester, VA (339,050), and Portland, ME ($451,450), Salisbury, MD (360,050), Albany, NY (360,050 )and Hartford, CT (302,850).
Mortgage Rates Top 3% as Would-be Buyers Pull Back: The 30-year fixed-rate mortgage topped the 3% threshold, averaging 3.02% this week, Freddie Mac reports. Despite the uptick, economists note that mortgage rates remain near historical lows. Since reaching an all-time low in January, mortgage rates have risen by more than 30 basis points, “and the impact on purchase demand has been noticeable,” says Sam Khater, Freddie Mac’s chief economist. “While purchase activity remains high, it has cooled off over the last few weeks and is currently on par with early March, prior to the pandemic.” Still, Khater predicts that the rise in mortgage rates over the next couple of months will likely be more muted in comparison to the last few weeks. The National Association of REALTORS® agrees, forecasting the 30-year fixed-rate mortgage to average 3% for the first half of this year. Expected job gains as the economy opens up may help lift buyer demand regardless of mortgage rate movement.
Report: 50% Fewer Homes for Sale This Year: The spring homebuying season is expected to be fierce for house hunters. Here’s the reason: More than 200,000 new listings have been absent from the U.S. housing market during the first two months of 2021 compared to levels seen over the last four years. Buyer demand is surging and there aren’t enough homes for sale. Inventory woes were common in markets even prior to the pandemic, but they’ve worsened since. There are nearly 50% fewer homes for sale this year than last year, according to realtor.com®’s newly released Monthly Housing Trends Report. What’s more, home buyers are seeing prices quickly rise. The median listing price nationwide in February increased nearly 14% over last year to $353,000. Unless we see some big improvements in the new listings trends over the coming months, buyers can expect stiff competition.
Real Estate Pros to Homeowners: Don’t Wait to Sell: A lot of homeowners are missing the best market now by waiting to sell. They are finding themselves with more negotiating power as buyer demand remains high and housing inventories are slim. The high demand is sparking home prices to surge. The median home price was $303,900 for an existing home in January—a 14% jump from the year prior, according to the National Association of REALTORS®. Homeowner equity has grown. Thirty percent of homes with a mortgage in the U.S. are now considered “equity-rich”. So what’s holding sellers back? They often have to buy as well and are struggling to find a home to move to. Potential sellers fear they’ll pay more for a comparable home, even if they’re downsizing. Strategies to help sellers deal with the stress: 1) buy first because this way they can take their time and not feel rushed or jump into any house just because they need to hurry up and move out. 2) list their homes and then accept an offer from a buyer who is willing to wait while they find a place to buy. 3) negotiate a rent-back agreement to allow them more time to shop for a home.
Sales Trends: January - February
February Single-Family Home Sales
(OLP: original list price • LP: list price • SP: sale price • DOM: days on market)
| Address | Style | sq ft | BR | BA (f/h) | OLP | LP | SP | SP/OLP | DOM |
| 166 Jackson Ave | Cape Cod | 1,663 | 3 | 1/1 | $209,900 | $194,900 | $187,000 | 89% | 15 |
| 675 Light St | Half Duplex | 1,188 | 2 | 1/1 | $199,900 | $199,900 | $200,000 | 100% | 50 |
| 30 Val Dr | Split Level | 1,248 | 3 | 2/0 | $270,000 | $270,000 | $275,100 | 102% | 22 |
| 60 James Farm Rd | Colonial, Farm House | 2,369 | 3 | 2/1 | $316,000 | $316,000 | $285,000 | 90% | 77 |
| 1184 Huntington Rd | Cape Cod | 1,976 | 3 | 1/0 | $299,900 | $299,900 | $289,000 | 96% | 65 |
| 309 Freeman Ave | Cape Cod | 1,396 | 3 | 1/0 | $297,740 | $297,740 | $297,740 | 100% | 87 |
| 110 Alvord St | Raised Ranch | 1,998 | 3 | 1/1 | $399,000 | $399,000 | $405,000 | 102% | 5 |
| 55 Forest Rd | Cape Cod | 2,639 | 3 | 2/1 | $415,777 | $415,777 | $443,277 | 107% | 21 |
| 107 Mohawk St | Colonial | 2,568 | 3 | 1/1 | $299,999 | $299,999 | $304,000 | 101% | 67 |
| 74 Sedgewick Ave | Cape Cod | 2,067 | 4 | 1/0 | $249,900 | $249,900 | $245,500 | 98% | 81 |
| 120 Sheffield Cir | Raised Ranch | 1,340 | 3 | 2/0 | $319,000 | $319,000 | $320,000 | 100% | 28 |
| 210 Parkwood Rd | Cape Cod | 1,636 | 3 | 2/0 | $365,000 | $365,000 | $380,000 | 104% | 45 |
| 89 Mohawk St | Colonial | 1,726 | 3 | 1/1 | $187,000 | $187,000 | $203,000 | 109% | 1 |
| 175 Cannon Dr | Raised Ranch | 2,162 | 4 | 2/1 | $369,900 | $369,900 | $378,500 | 102% | 34 |
| 205 York St | Cape Cod | 1,518 | 3 | 1/0 | $399,900 | $399,900 | $395,000 | 99% | 65 |
| 308 Highland Ave | Cape Cod | 1,996 | 3 | 2/0 | $365,000 | $365,000 | $400,000 | 110% | 1 |
| 164 Ryan Ave | Half Duplex | 1,200 | 3 | 1/1 | $219,000 | $185,000 | $185,000 | 84% | 55 |
| 174 3rd Ave | Cape Cod | 1,485 | 3 | 2/0 | $379,000 | $349,000 | $356,000 | 94% | 68 |
| 61 Delaware Dr | Ranch | 1,050 | 3 | 1/0 | $319,900 | $319,900 | $325,500 | 102% | 5 |
| 25 Ferndale Ave | Cape Cod | 1,482 | 4 | 1/0 | $269,900 | $269,900 | $260,000 | 96% | 17 |
| 374 Swanson Ave | Colonial | 1,438 | 3 | 1/1 | $264,900 | $264,900 | $265,562 | 100% | 34 |
| 181 Castle Dr | Colonial | 1,531 | 4 | 2/0 | $359,900 | $359,900 | $359,000 | 100% | 13 |
| 12 Sycamore Cir | Cape Cod | 2,011 | 4 | 2/0 | $350,000 | $350,000 | $359,000 | 103% | 36 |
| 85 Brinsmayd Ave | Ranch | 3,294 | 4 | 3/1 | $525,000 | $509,900 | $509,000 | 97% | 41 |
| 1050 Chapel St | Cape Cod, Colonial | 2,227 | 4 | 3/0 | $399,000 | $399,000 | $399,000 | 100% | 92 |
| 60 Bates St | Ranch | 1,040 | 3 | 2/0 | $229,000 | $199,000 | $193,000 | 84% | 408 |
| 377 Ferndale Ave | Ranch | 1,511 | 3 | 2/0 | $329,000 | $329,000 | $345,000 | 105% | 46 |
| 121 Evergreen Dr | Ranch | 1,885 | 3 | 2/1 | $429,000 | $429,000 | $445,000 | 104% | 67 |
| 91 Lordship Rd | Ranch | 1,868 | 3 | 1/0 | $339,000 | $339,000 | $342,500 | 101% | 34 |
| 255 Abram St | Cape Cod | 1,897 | 4 | 2/0 | $349,900 | $349,900 | $370,000 | 106% | 7 |
| 265 Quenby Pl | Ranch | 2,057 | 3 | 3/1 | $409,000 | $409,000 | $425,000 | 104% | 31 |
| 333 Hollister St | Ranch | 2,664 | 3 | 2/1 | $279,900 | $279,900 | $292,500 | 105% | 66 |
| 170 Pumpkin Ground Rd | Colonial | 2,000 | 3 | 1/1 | $399,000 | $399,000 | $390,000 | 98% | 11 |
| Units Sold: 33 | $329,000 | $329,000 | $342,500 | 100% | 36 |
Are You Interested In A Real Estate Review?