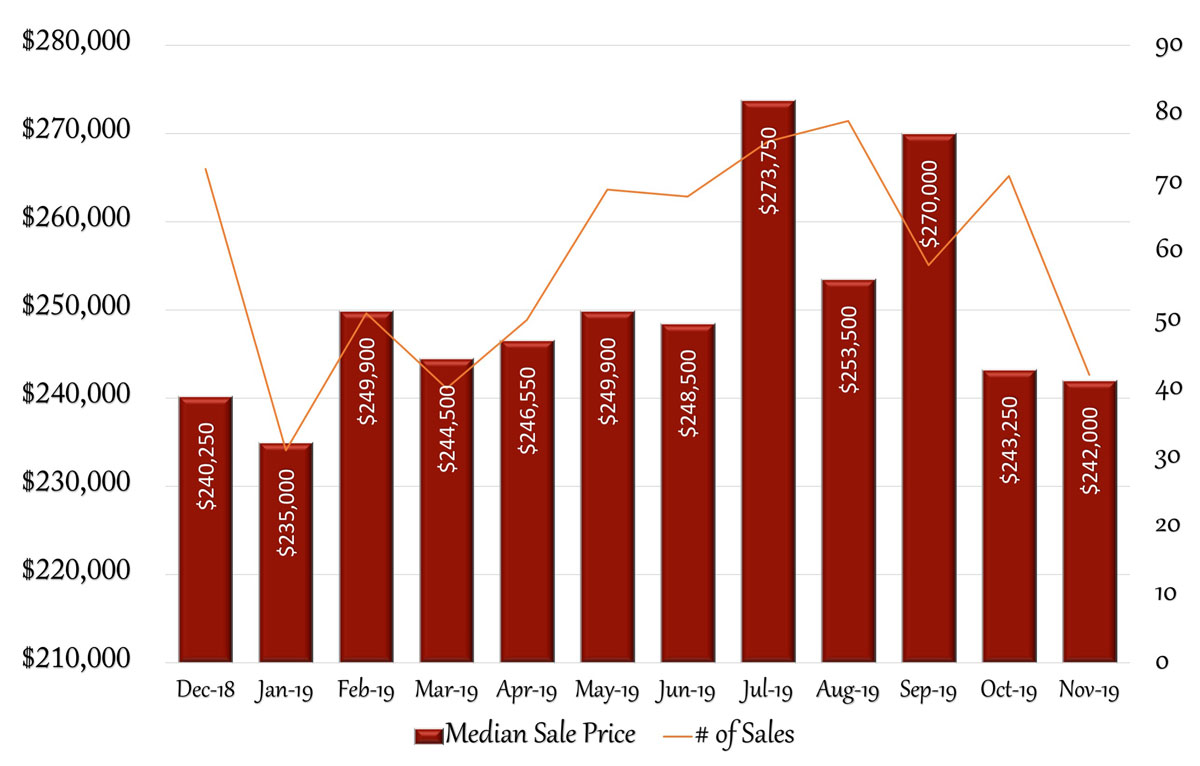
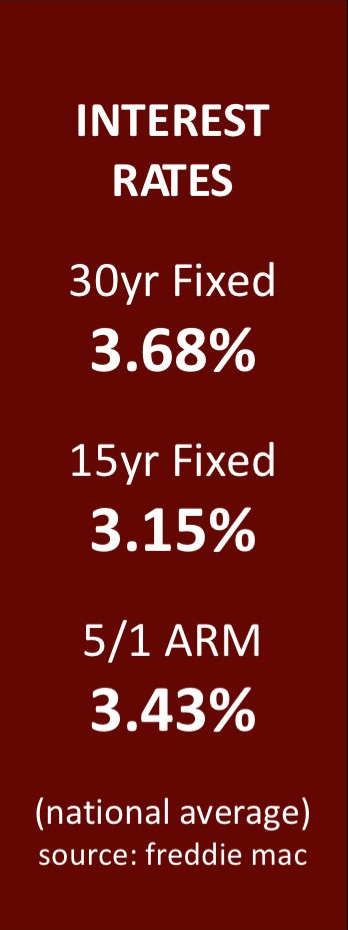
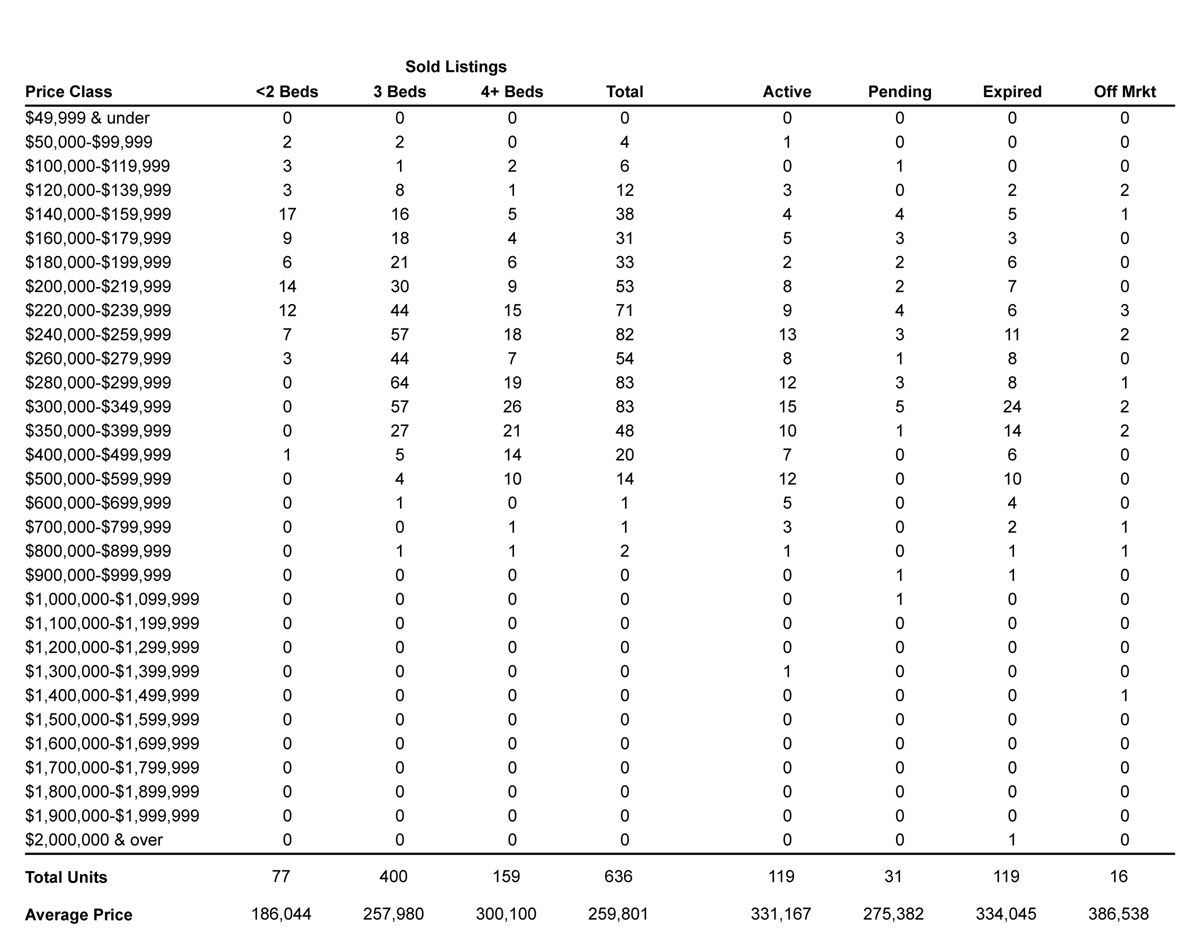
The November real estate market experienced a slight downturn over October’s activity overall. The median sales price was down only ½ percent and the days on market increased by about a week, from 61 days in October to 68 days in November. The biggest change was in the number of units sold, from 71 to 42, nearly a 41% drop. The number of active listings also declined as fewer houses came on the market, which kept the months of supply at 2.9 months, still very favorable to sellers. In the months moving toward Winter, slowdowns are common as more buyers are active during the Spring and Summer, with sellers stepping up to meet the demand. With interest rates at 3.68%, solidly below 4% since the beginning of June, buyers should have more confidence and resources to make a purchase now and moving forward. If you have any questions, or if you know anyone who is thinking of buying or selling real estate, I’d be happy to speak with you.
12 Month Sales Activity
Housing Stats
(change from previous month)
| Median Sale Price: | $239,000 |
| change: | -0.51% |
| YTD change: | 2.98% |
| Units Sold: | 43 |
| change: | -40.85% |
| Active Listings: | 165 |
| change: | -10.33% |
| New Listings: | 46 |
| change: | -14.81% |
| Days on Market: | 68 |
| change: | 11.48% |
| Months of Supply: | 2.90 (Seller's Market) |
| change: | -6.45% |
November Single-Family Home Sales
(OLP: original list price • LP: list price • SP: sale price • DOM: days on market)
| Address | Style | sq ft | BR | BA (f/h) | OLP | LP | SP | SP/OLP | DOM |
| 262 Reed St. | Cape Cod | 1,715 | 4 | 2/0 | $244,900 | $209,900 | $187,000 | 76% | 200 |
| 93 Woodcrest Ave. | Colonial | 1,392 | 3 | 2/0 | $275,000 | $254,900 | $250,000 | 91% | 97 |
| 326 Knowlton St. | Cape Cod | 2,037 | 3 | 2/0 | $239,000 | $239,000 | $230,000 | 96% | 31 |
| 170 Milford Ave. | Cape Cod | 2,578 | 3 | 2/0 | $269,900 | $275,000 | $275,000 | 102% | 87 |
| 231 Morningside Terrace | Colonial | 2,280 | 3 | 2/1 | $465,000 | $444,900 | $446,900 | 96% | 130 |
| 47 Ryan Ave. | Half Duplex | 1,176 | 3 | 1/2 | $99,000 | $99,000 | $95,000 | 96% | 36 |
| 1400 North Ave. | Bungalow | 1,329 | 3 | 1/1 | $234,900 | $219,900 | $210,000 | 89% | 87 |
| 39 Crestwood Rd. | Cape Cod, Colonial | 2,231 | 3 | 2/1 | $265,000 | $265,000 | $275,000 | 104% | 68 |
| 111 N. Parade St. | Colonial | 904 | 2 | 1/1 | $175,000 | $165,000 | $165,000 | 94% | 189 |
| 136 Albert Ave. | Cape Cod | 1,822 | 3 | 1/0 | $245,000 | $229,900 | $224,000 | 91% | 87 |
| 195 Morehouse Ave. | Ranch | 1,656 | 3 | 1/0 | $239,000 | $239,000 | $245,000 | 103% | 1 |
| 544 Columbus Ave. | Colonial, Half Duplex | 1,292 | 3 | 2/0 | $155,000 | $152,250 | $120,000 | 77% | 73 |
| 68 Clarendon St. | Cape Cod | 1,173 | 3 | 1/0 | $249,900 | $269,900 | $258,000 | 103% | 7 |
| 105 Evelyn St. | Colonial | 1,572 | 3 | 2/1 | $269,900 | $269,900 | $269,000 | 100% | 6 |
| 30 Evelyn St. | Ranch | 1,992 | 2 | 1/0 | $179,000 | $179,000 | $171,000 | 96% | 68 |
| 58 Glenwood Ave. | Colonial | 1,348 | 3 | 1/0 | $249,900 | $249,900 | $249,900 | 100% | 63 |
| 55 Hanson Place | Cape Cod | 1,436 | 4 | 1/0 | $225,000 | $159,000 | $157,000 | 70% | 288 |
| 307 Burbank Ave. | Ranch | 1,242 | 2 | 1/0 | $220,000 | $220,000 | $205,000 | 93% | 17 |
| 37 London Terrace | Cape Cod | 1,541 | 3 | 1/0 | $249,900 | $239,500 | $225,000 | 90% | 60 |
| 160 Otis St. | Colonial | 1,380 | 3 | 2/0 | $199,000 | $199,000 | $190,000 | 95% | 23 |
| 65 Edgewood St. | Cape Cod | 1,503 | 3 | 1/0 | $237,500 | $237,500 | $235,000 | 99% | 14 |
| 741 Wigwam Lane | Cape Cod | 1,546 | 3 | 1/1 | $359,900 | $299,800 | $297,000 | 83% | 173 |
| 76 Lighthouse Ave. | Cape Cod | 2,840 | 3 | 2/1 | $484,900 | $474,900 | $455,000 | 94% | 138 |
| 146 Ferndale Ave. | Cape Cod | 1,397 | 3 | 2/0 | $229,000 | $229,000 | $222,000 | 97% | 45 |
| 96 Bronson Rd. | Ranch | 1,890 | 3 | 2/0 | $335,000 | $335,000 | $325,000 | 97% | 15 |
| 85 Legion Ave. | Cape Cod | 1,178 | 3 | 1/1 | $220,000 | $220,000 | $225,000 | 102% | 23 |
| 134 Terrill Rd. | Cape Cod | 2,505 | 3 | 2/0 | $309,000 | $299,000 | $290,000 | 94% | 186 |
| 138 Sutton Ave. | Colonial | 1,814 | 4 | 2/0 | $309,900 | $299,900 | $292,000 | 94% | 158 |
| 49 Academy Hill Terrace | Colonial | 2,615 | 4 | 3/0 | $389,900 | $389,900 | $378,000 | 97% | 60 |
| 664 Nichols Ave. | Colonial | 1,426 | 3 | 2/0 | $195,500 | $189,900 | $181,500 | 93% | 132 |
| 2149 Elm St. | Colonial, Antique | 2,856 | 5 | 2/1 | $399,900 | $289,000 | $281,200 | 70% | 583 |
| 60 Fairfax Dr. | Cape Cod | 2,250 | 3 | 3/1 | $379,900 | $359,900 | $366,000 | 96% | 34 |
| 233 Washington Parkway | Colonial | 1,962 | 4 | 2/1 | $389,000 | $389,000 | $375,000 | 96% | 50 |
| 91 Boswell St. | Cape Cod | 1,248 | 4 | 1/0 | $224,900 | $215,000 | $220,000 | 98% | 87 |
| 132 Meritine Ave. | Ranch, Bungalow | 1,808 | 2 | 1/0 | $245,000 | $235,000 | $230,000 | 94% | 120 |
| 640 King St. | Colonial | 1,890 | 3 | 1/1 | $259,900 | $259,900 | $255,000 | 98% | 20 |
| 192 Burritt Ave. | Colonial | 2,941 | 4 | 1/1 | $319,900 | $304,900 | $290,000 | 91% | 168 |
| 172 Knowlton St. | Half Duplex | 1,324 | 3 | 1/1 | $125,000 | $125,000 | $131,000 | 105% | 41 |
| 22 Selleck Place | Colonial | 1,196 | 3 | 1/1 | $254,900 | $254,900 | $265,000 | 104% | 30 |
| 24 Champion Terrace | Cape Cod | 1,426 | 4 | 1/0 | $239,000 | $239,000 | $239,000 | 100% | 75 |
| 122 Liberty St. | Cape Cod | 1,098 | 3 | 1/0 | $234,900 | $219,000 | $212,400 | 90% | 88 |
| 375 N. Abram St. | Ranch | 1,092 | 3 | 1/0 | $224,900 | $224,900 | $215,000 | 96% | 17 |
| 55 Baxter St. | Cape Cod, Colonial | 1,650 | 4 | 2/1 | $449,900 | $419,900 | $390,000 | 87% | 164 |
| Units Sold: 43 | $245,000 | $239,000 | $239,000 | 96% | 68 |
Sales Trends: January-November
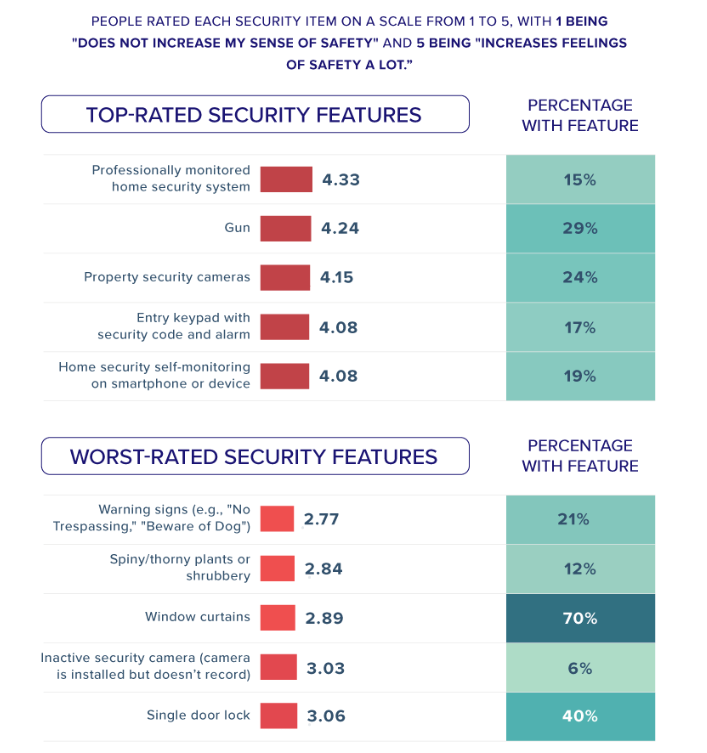
Smart Home Technology:
1. Voice Assistant: The most common way to get started with smart-home technology is with a voice assistant device such as an Amazon Echo (Alexa) or Google Home Assistant. These come in a variety of sizes, from the Google Mini or Echo Dot to the larger hubs such as the Google Hub or Echo Show. Placed throughout the home, you can easily look up information, play music, and control other smart-home devices. From there, choose other smart-home products that are compatible with your voice assistant. 2. Smart Thermostat: The next item to consider is a smart thermostat. Popular brands include Ecobee, Nest, and Honeywell. Nest has been acquired by Google, which is transitioning the “works with Nest” program to work with Google Assistant and offer additional products such as a video doorbell, a lock, cameras, and a security system. Ecobee includes an additional occupancy and temperature sensor that can be placed in any room of the home. Both systems have scheduling and geofence features that adjust settings based on whether the owner is home (using their phone). 3. Video Doorbell: Allows the homeowner to see who’s at the door, monitor when packages arrive, and avoid those pesky door-to-door salespeople (except your friendly, informative neighborhood Realtor…). Ring has been a leader in video doorbells, while there are other great options from Google, Simplisafe, and Skybell. 4. Lighting: Whether you install a switch at the wall or just replace a few lightbulbs, smart lighting is a popular choice for convenience, security, and entertainment. A system such as Lutron, which does not require a neutral wire and can be controlled via voice or application with a smart bridge device. Philips Hue or LIFX bulbs are both great options for lighting up a room with color, and each includes a variety of scenes that can help set the mood. Smart lights and switches can also be integrated to other devices such as door or motion sensors. 5. Plugs: Plugs are another cost-effective way to control “dumb” devices such as lamps, fans, or holiday lights. This allows the homeowner to setup a variety of automations and use their smartphone or voice assistant to control. Some versions also include energy monitoring, used to trigger other automations or to simply let the owner know how much power they’re currently using. |

Thinking about adding some smart touches to your home?