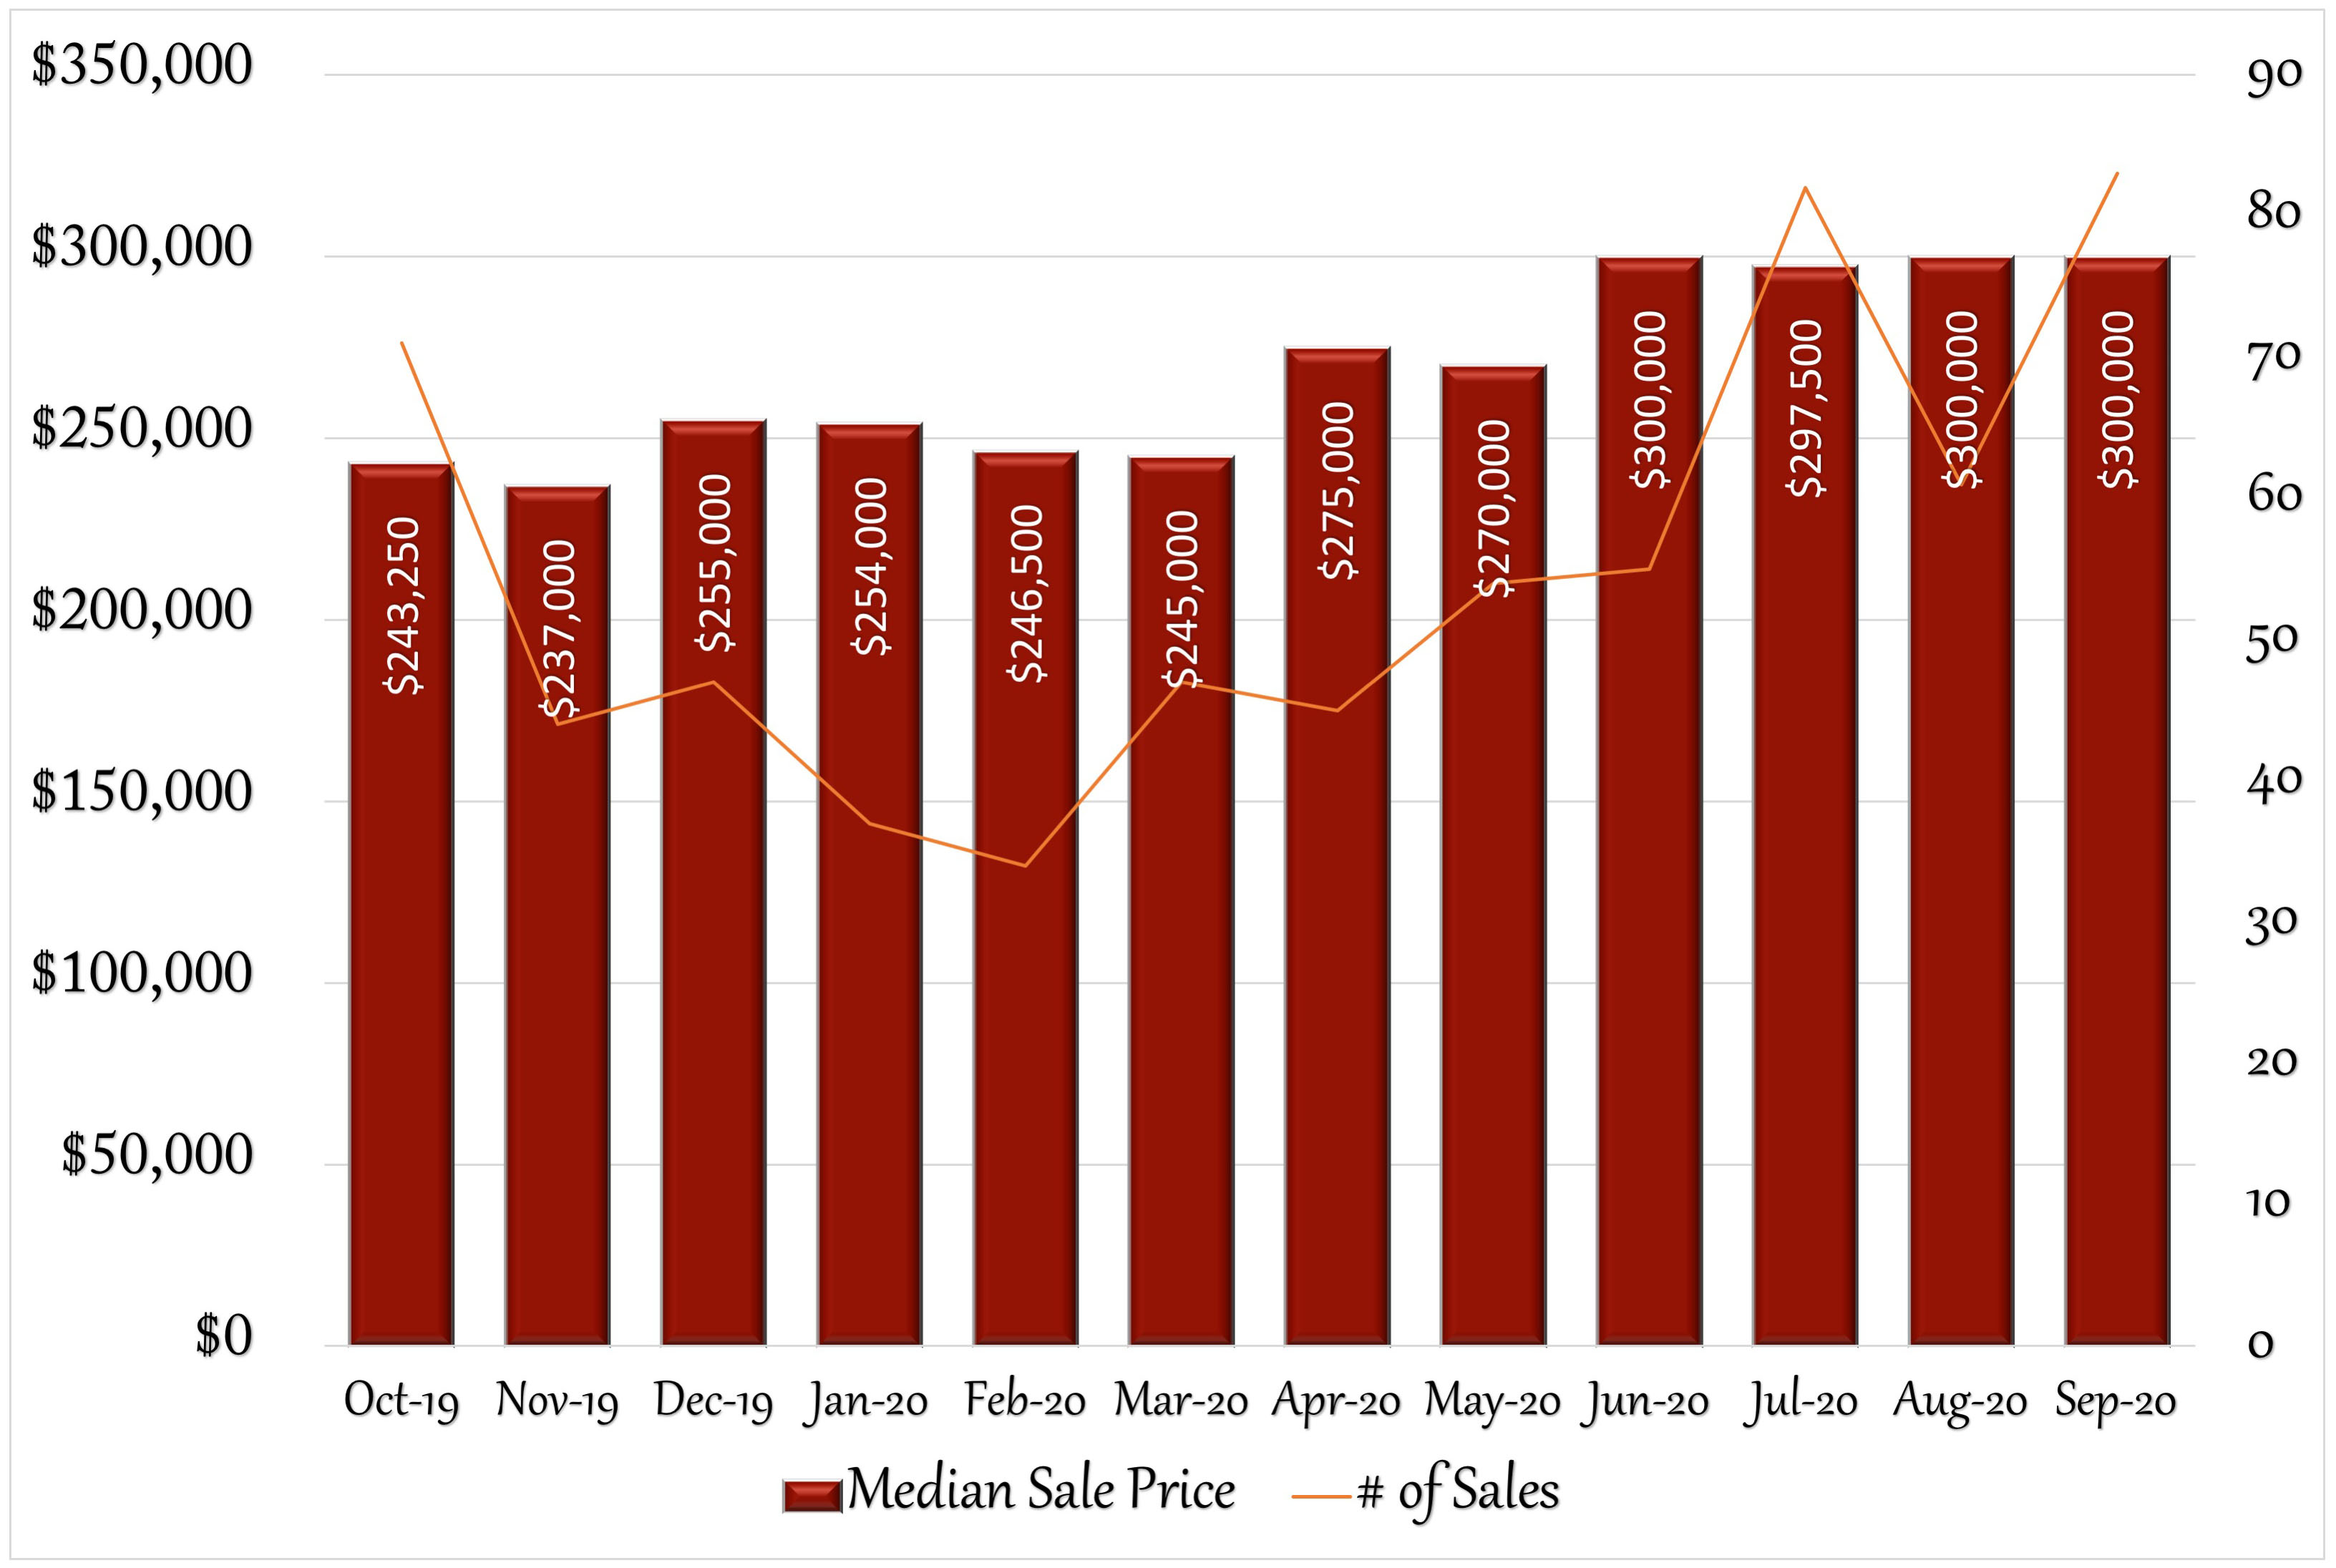
Stratford’s real estate market has been very stable for the past 4 months. The median sales price has been hovering around $300,000 since June, only dropping slightly in July to $297,500. Sales for September have been strong, at 88 houses sold, compared to a year ago, with 58 homes sold. Buyer demand has been strong, with an influx of out of state buyers looking to take advantage of Stratford’s strong housing market and historically low interest rates. And homeowners have been meeting that demand more so then in other nearby towns. September saw 110 new listings in September, compared to 63 a year ago. Buyers are acting quickly, as days on market continues do drop: 26 days for September, compared to 33 in August, 35 in July and 45 in June. Even with those strong sales numbers, buyer demand is still high, as the months of supply still points to a strong sellers-market. September’s months of inventory dropped for a 4th straight month to 1.9 months. With pending sales of 65 homes and continued low interest rates (2.88% 30yr fixed), buyer demand is expected to continue. Do you know anyone looking for more information about their real estate market? I’d be happy to help.
12 Month Sales Activity
Housing Stats
(change from previous month)
| Median Sale Price: | $300,000 |
| change: | 0.00% |
| YTD change: | 18.11% |
| Units Sold: | 83 |
| change: | 36.07% |
| Active Listings: | 196 |
| change: | 13.29% |
| New Listings: | 110 |
| change: | 11.11% |
| Days on Market: | 26 |
| change: | -21.21% |
| Months of Supply: | 1.90 (Seller's Market) |
| change: | -17.39% |

Economic News:
Stock Market: After a strong performance in August, the major US stock markets suffered losses in September. The NASDEQ was down 5.16%, S&P 500 down 3.92% and the Dow Jones was down 2.28%. Despite September’s pullback, the NASDEQ and S&P 500 were up for the year, 24.46% and 4.09% respectivly, while the Dow Jones YTD performance for the end of September was -2.65%.
Employment: September saw another drop in the unemployment rate from 8.4% in August to 7.9%, according to the Bureau of Labor Statistics. Although a real improvement since April’s high of 14.7%, this will be the highest uneployment rate going into an election since first being recorded in 1948. September’s biggest job gains came in the leisure and hospitality sectors, followed by retail trade.
Real Estate: Real estate sales continued to be brisk nationwide. Existing-home sales continued to climb in August, marking three consecutive months of positive sales gains, according to the National Association of Realtors®. Each of the four major regions experienced both month-over-month and year-over-year growth, with the Northeast seeing the greatest improvement from the prior month.
2020 Local Real Estate Price Trends:
2020 continues to be a strong year for the area real estate markets when compared to 2019’s first 9 months. All towns show increases in median sales price, with many over 10%. The days on market have also decreased significantly, except for Orange and Ridgefield, which have both increased| 1/19-9/19 | 1/20-9/20 | Change | |
| Bethel | $345,000 | $365,000 | 5.80% |
| Bridgeport | $200,000 | $235,000 | 17.50% |
| Easton | $557,000 | $560,000 | 0.54% |
| Fairfield | $590,000 | $655,000 | 11.02% |
| Milford | $305,000 | $350,000 | 14.75% |
| Monroe | $374,000 | $404,000 | 8.02% |
| Newtown | $380,100 | $424,500 | 11.68% |
| Norwalk | $486,509 | $530,000 | 8.94% |
| Orange | $375,000 | $392,500 | 4.67% |
| Redding | $530,500 | $555,000 | 4.62% |
| Ridgefield | $635,000 | $672,500 | 5.91% |
| Shelton | $337,500 | $370,000 | 9.63% |
| Stratford | $252,000 | $280,000 | 11.11% |
| Trumbull | $385,000 | $421,813 | 9.56% |
| Weston | $687,000 | $790,000 | 14.99% |
| Westport | $1,182,500 | $1,325,000 | 12.05% |
| Wilton | $720,000 | $782,500 | 8.68% |

Stage A Cozy Outdoor Space For Cooler Weather:
During the pandemic, outdoor space has become a premium consideration. Homeowners are sprucing up their spaces to maximize every square inch of their properties, and home buyers are reportedly giving more weight to the outdoor appeal of homes. Here are a few ways to spend more tie outdoors as the weather cools:
1: Add a fire pit. Outdoor fireplaces or fire pits are a big win once the sun goes down and the weather cools off.
2: Add plush cushions and blankets. Add seat cushions, outdoor pillows, and a basket of warm blankets to wrought-iron deck chairs and enjoy a cozy evining outdoors.
3: Propane Heaters. Patio heaters have become one of the hottest accessories this fall as the temperature drops. Try a standing propane heater, electric heat lamp, or an infrared heater.
4: All-weather rugs. Outdoor rugs can add an extra layer to your outdoor space can cozy it up.
5: Extra lighting. Outdoor lamps can help with ambiance. Consider adding Edison bulbs, glowing lanterns, mason jars with tee lights or tiki torches.
Sales Trends: January-September
October Single-Family Home Sales
(OLP: original list price • LP: list price • SP: sale price • DOM: days on market)
| Address | Style | sq ft | BR | BA (f/h) | OLP | LP | SP | SP/OLP | DOM |
| 255 Hollister St. | Cape Cod | 1,756 | 4 | 1/1 | $249,900 | $249,900 | $250,000 | 100% | 65 |
| 23 Circle Dr. | Cape Cod | 1,427 | 2 | 1/0 | $259,900 | $245,000 | $255,000 | 98% | 23 |
| 55 Allyndale Dr. | Cape Cod | 1,158 | 3 | 1/0 | $274,900 | $274,900 | $275,000 | 100% | 10 |
| 145 Twin Oaks Terrace | Raised Ranch | 2,162 | 3 | 2/0 | $334,900 | $334,900 | $342,500 | 102% | 25 |
| 95 Baxter St. | Colonial | 2,525 | 3 | 2/1 | $529,900 | $475,000 | $475,000 | 90% | 19 |
| 249 Sherwood Place | Colonial | 1,119 | 3 | 1/0 | $199,900 | $199,900 | $175,000 | 88% | 17 |
| 22 Jackson Ave. | Half Duplex | 1,806 | 3 | 1/1 | $196,500 | $196,500 | $188,000 | 96% | 56 |
| 200 Chelsea St. | Cape Cod | 1,579 | 3 | 1/0 | $245,000 | $235,000 | $205,000 | 84% | 20 |
| 321 Knowlton St. | Cape Cod | 1,155 | 2 | 1/0 | $239,900 | $239,900 | $255,000 | 106% | 4 |
| 115 Lincoln St. | Ranch | 1,200 | 3 | 1/0 | $274,900 | $274,900 | $275,000 | 100% | 57 |
| 691 King St. | Ranch | 1,052 | 2 | 1/0 | $269,900 | $259,900 | $255,000 | 94% | 39 |
| 65 Sulik Terrace | Cape Cod | 1,514 | 3 | 2/0 | $270,000 | $270,000 | $295,000 | 109% | 4 |
| 90 Old Town Dr. | Cape Cod | 1,377 | 3 | 1/1 | $234,910 | $234,910 | $235,000 | 100% | 47 |
| 735 Robin Lane | Ranch | 1,242 | 2 | 2/0 | $259,900 | $259,900 | $265,000 | 102% | 66 |
| 25 Seabreeze Circle | Ranch | 1,144 | 3 | 2/0 | $279,900 | $279,900 | $270,000 | 96% | 13 |
| 127 Plymouth St. | Colonial | 1,469 | 3 | 2/0 | $279,900 | $279,900 | $290,000 | 104% | 1 |
| 170 Hollywood Ave. | Split Level | 1,466 | 3 | 1/1 | $324,900 | $319,500 | $320,000 | 98% | 56 |
| 176 Lawlor Terrace | Cape Cod | 1,426 | 3 | 2/0 | $325,000 | $325,000 | $340,000 | 105% | 15 |
| 345 Sunnybank Ave. | Split Level | 1,767 | 3 | 2/0 | $329,900 | $329,900 | $342,000 | 104% | 6 |
| 185 Mcleod Place | Ranch | 2,604 | 3 | 2/1 | $379,900 | $369,900 | $375,000 | 99% | 24 |
| 112 Victory St. | Colonial, Bungalow | 1,155 | 2 | 1/0 | $229,900 | $229,900 | $235,000 | 102% | 3 |
| 58 Hartland St. | Cape Cod | 2,205 | 3 | 2/0 | $429,900 | $419,900 | $395,000 | 92% | 27 |
| 85 Frash St. | Half Duplex | 1,218 | 3 | 1/1 | $142,000 | $134,500 | $132,000 | 93% | 244 |
| 186 Delaware Dr. | Cape Cod | 1,511 | 3 | 2/0 | $229,900 | $229,900 | $230,000 | 100% | 92 |
| 186 Red Bird Dr. | Ranch | 1,269 | 3 | 2/0 | $234,900 | $234,900 | $234,000 | 100% | 10 |
| 359 Nichols Ave. | Split Level | 1,636 | 3 | 1/1 | $265,000 | $264,500 | $250,000 | 94% | 98 |
| 561 Henry Avenue Ext. | Cape Cod | 1,160 | 3 | 1/1 | $279,900 | $279,900 | $265,000 | 95% | 16 |
| 26 Parkway Dr. | Colonial | 1,228 | 2 | 1/0 | $289,000 | $289,000 | $272,000 | 94% | 37 |
| 5300 Main St. | Ranch | 3,142 | 3 | 2/1 | $429,900 | $399,900 | $385,000 | 90% | 796 |
| 60 Bayview Blvd. | Cape Cod | 2,701 | 4 | 2/1 | $599,900 | $599,900 | $550,000 | 92% | 21 |
| 801 Birdseye St. | Cape Cod, Bungalow | 1,033 | 3 | 1/0 | $159,900 | $159,900 | $152,000 | 95% | 233 |
| 142 Regency Terrace | Cape Cod | 1,163 | 4 | 1/0 | $199,900 | $199,900 | $209,100 | 105% | 62 |
| 66 Edwin St. | Ranch | 1,104 | 3 | 2/0 | $229,900 | $229,900 | $245,000 | 107% | 72 |
| 181 Delaware Dr. | Cape Cod | 1,346 | 3 | 2/0 | $287,000 | $287,000 | $295,000 | 103% | 5 |
| 136 Porter St. | Ranch | 1,373 | 2 | 1/0 | $309,900 | $299,900 | $295,000 | 95% | 23 |
| 66 Burbank Dr. | Ranch | 2,015 | 3 | 2/0 | $309,900 | $309,900 | $312,000 | 101% | 67 |
| 12 Rowland St. | Colonial | 1,518 | 3 | 1/1 | $325,000 | $325,000 | $326,000 | 100% | 4 |
| 185 Peters Lane | Colonial | 2,342 | 4 | 2/1 | $419,900 | $419,900 | $430,000 | 102% | 33 |
| 816 Housatonic Avenue Ext. | Colonial | 2,289 | 4 | 2/1 | $525,000 | $500,000 | $500,000 | 95% | 65 |
| 155 Tavern Rock Rd. | Cape Cod | 1,677 | 3 | 2/0 | $349,900 | $349,900 | $365,000 | 104% | 2 |
| 35 Post Oak Rd. | Colonial | 2,080 | 4 | 2/1 | $389,900 | $389,900 | $400,000 | 103% | 16 |
| 40 High Park Ave. | Bungalow | 1,088 | 2 | 1/0 | $110,000 | $110,000 | $162,000 | 147% | 12 |
| 71 Tavern Rock Rd. | Ranch | 1,712 | 4 | 1/0 | $129,900 | $129,900 | $190,000 | 146% | 16 |
| 1080 Wells Place | Cape Cod | 1,839 | 2 | 2/0 | $244,806 | $244,806 | $262,500 | 107% | 9 |
| 336 Highland Ave. | Cape Cod | 1,375 | 3 | 2/0 | $319,000 | $319,000 | $330,500 | 104% | 2 |
| 160 Timber Ridge Rd. | Colonial, Contemporary | 2,341 | 3 | 2/1 | $399,000 | $399,000 | $432,000 | 108% | 26 |
| 165 Fairchild Rd. | Colonial | 2,552 | 4 | 2/1 | $475,000 | $475,000 | $450,000 | 95% | 55 |
| 315 Riverdale Dr. | Cape Cod | 1,746 | 3 | 2/0 | $494,900 | $494,900 | $458,000 | 93% | 53 |
| 559 Short Beach Rd. | Colonial, Victorian | 2,710 | 4 | 2/1 | $789,000 | $769,000 | $749,000 | 95% | 38 |
| 11 Mill River Dr. | Colonial | 1,580 | 3 | 1/1 | $319,900 | $319,900 | $320,000 | 100% | 40 |
| 240 Old Coach Lane | Contemporary | 3,398 | 4 | 3/1 | $420,000 | $420,000 | $420,000 | 100% | 30 |
| 97 1st Ave. | Colonial | 3,373 | 4 | 2/1 | $749,000 | $724,900 | $710,000 | 95% | 121 |
| 149 Columbus Ave. | Half Duplex | 1,224 | 3 | 1/1 | $190,000 | $190,000 | $195,000 | 103% | 6 |
| 90 Reut Dr. | Ranch | 1,144 | 3 | 2/0 | $327,900 | $327,900 | $340,000 | 104% | 53 |
| 100 Delwood Rd. | Ranch | 2,592 | 3 | 2/0 | $350,000 | $360,000 | $361,000 | 103% | 36 |
| 1096 Whippoorwill Lane | Ranch | 3,312 | 4 | 2/1 | $369,900 | $369,900 | $380,000 | 103% | 15 |
| 265 Bruce Ave. | Colonial | 832 | 2 | 1/0 | $199,950 | $199,950 | $195,000 | 98% | 30 |
| 46 Elmhurst Ave. | Colonial | 1,644 | 4 | 1/1 | $299,000 | $299,000 | $310,000 | 104% | 38 |
| 69 Pleasantview Ave. | Ranch | 2,463 | 3 | 1/1 | $315,000 | $315,000 | $321,000 | 102% | 21 |
| 94 Stonybrook Rd. | Cape Cod | 1,160 | 3 | 1/0 | $229,900 | $229,900 | $230,000 | 100% | 38 |
| 763 Nichols Ave. | Cape Cod | 1,293 | 4 | 1/0 | $290,000 | $290,000 | $300,000 | 103% | 5 |
| 400 Keating Dr. | Colonial, Ranch | 2,572 | 4 | 2/1 | $389,000 | $369,000 | $335,000 | 86% | 56 |
| 34 Barrows Terrace | Cape Cod | 3,420 | 4 | 2/0 | $349,000 | $349,000 | $380,000 | 109% | 29 |
| 25 Watkins St. | Cape Cod | 1,206 | 3 | 1/0 | $190,000 | $190,000 | $195,000 | 103% | 14 |
| 832 Nichols Ave. | Cape Cod | 1,650 | 3 | 1/1 | $300,000 | $300,000 | $310,000 | 103% | 33 |
| 30 Shea Terrace | Cape Cod | 1,717 | 3 | 2/0 | $339,000 | $339,000 | $344,000 | 101% | 91 |
| 959 Wells Place | Colonial | 2,300 | 3 | 3/1 | $399,900 | $399,900 | $420,500 | 105% | 4 |
| 360 High View Dr. | Colonial | 2,977 | 4 | 3/1 | $479,900 | $479,900 | $479,900 | 100% | 32 |
| 5 Marr St. | Bungalow | 645 | 1 | 1/0 | $174,900 | $174,900 | $177,500 | 101% | 4 |
| 515 Hollister St. | Cape Cod | 1,218 | 3 | 1/0 | $199,000 | $199,000 | $190,000 | 95% | 45 |
| 123 Wiklund Ave. | Cape Cod | 1,102 | 3 | 2/0 | $245,000 | $245,000 | $259,000 | 106% | 2 |
| 858 Freeman Ave. | Ranch | 1,245 | 3 | 2/0 | $290,000 | $290,000 | $300,000 | 103% | 2 |
| 100 Brookbend Dr. | Cape Cod | 1,183 | 3 | 1/0 | $300,000 | $300,000 | $320,000 | 107% | 7 |
| 297 Reeds Lane | Colonial | 1,908 | 3 | 2/0 | $325,000 | $325,000 | $330,000 | 102% | 25 |
| 802 Housatonic Avenue Ext. | Colonial | 2,909 | 3 | 2/2 | $565,000 | $559,000 | $552,000 | 98% | 115 |
| 88 Peck St. | Hi-Ranch | 1,896 | 3 | 2/0 | $269,000 | $269,000 | $280,000 | 104% | 24 |
| 331 Freeman Ave. | Cape Cod | 1,934 | 3 | 2/0 | $285,000 | $285,000 | $304,000 | 107% | 73 |
| 225 Edgewood St. | Ranch | 1,452 | 3 | 1/1 | $300,000 | $300,000 | $325,000 | 108% | 6 |
| 85 Winfield Dr. | Colonial | 1,760 | 2 | 1/0 | $209,900 | $209,900 | $225,123 | 107% | 12 |
| 25 Arbor St. | Cape Cod | 971 | 2 | 1/0 | $239,900 | $239,900 | $239,900 | 100% | 47 |
| 867 Nichols Ave. | Colonial | 1,295 | 3 | 1/1 | $239,000 | $239,000 | $245,000 | 103% | 30 |
| 86 Ferndale Ave. | Cape Cod | 1,617 | 3 | 1/0 | $269,900 | $269,900 | $285,000 | 106% | 26 |
| 156 Warwick Ave. | Colonial | 1,706 | 4 | 1/1 | $322,000 | $322,000 | $315,000 | 98% | 40 |
| Units Sold: 83 | $290,000 | $290,000 | $300,000 | 101% | 26 |