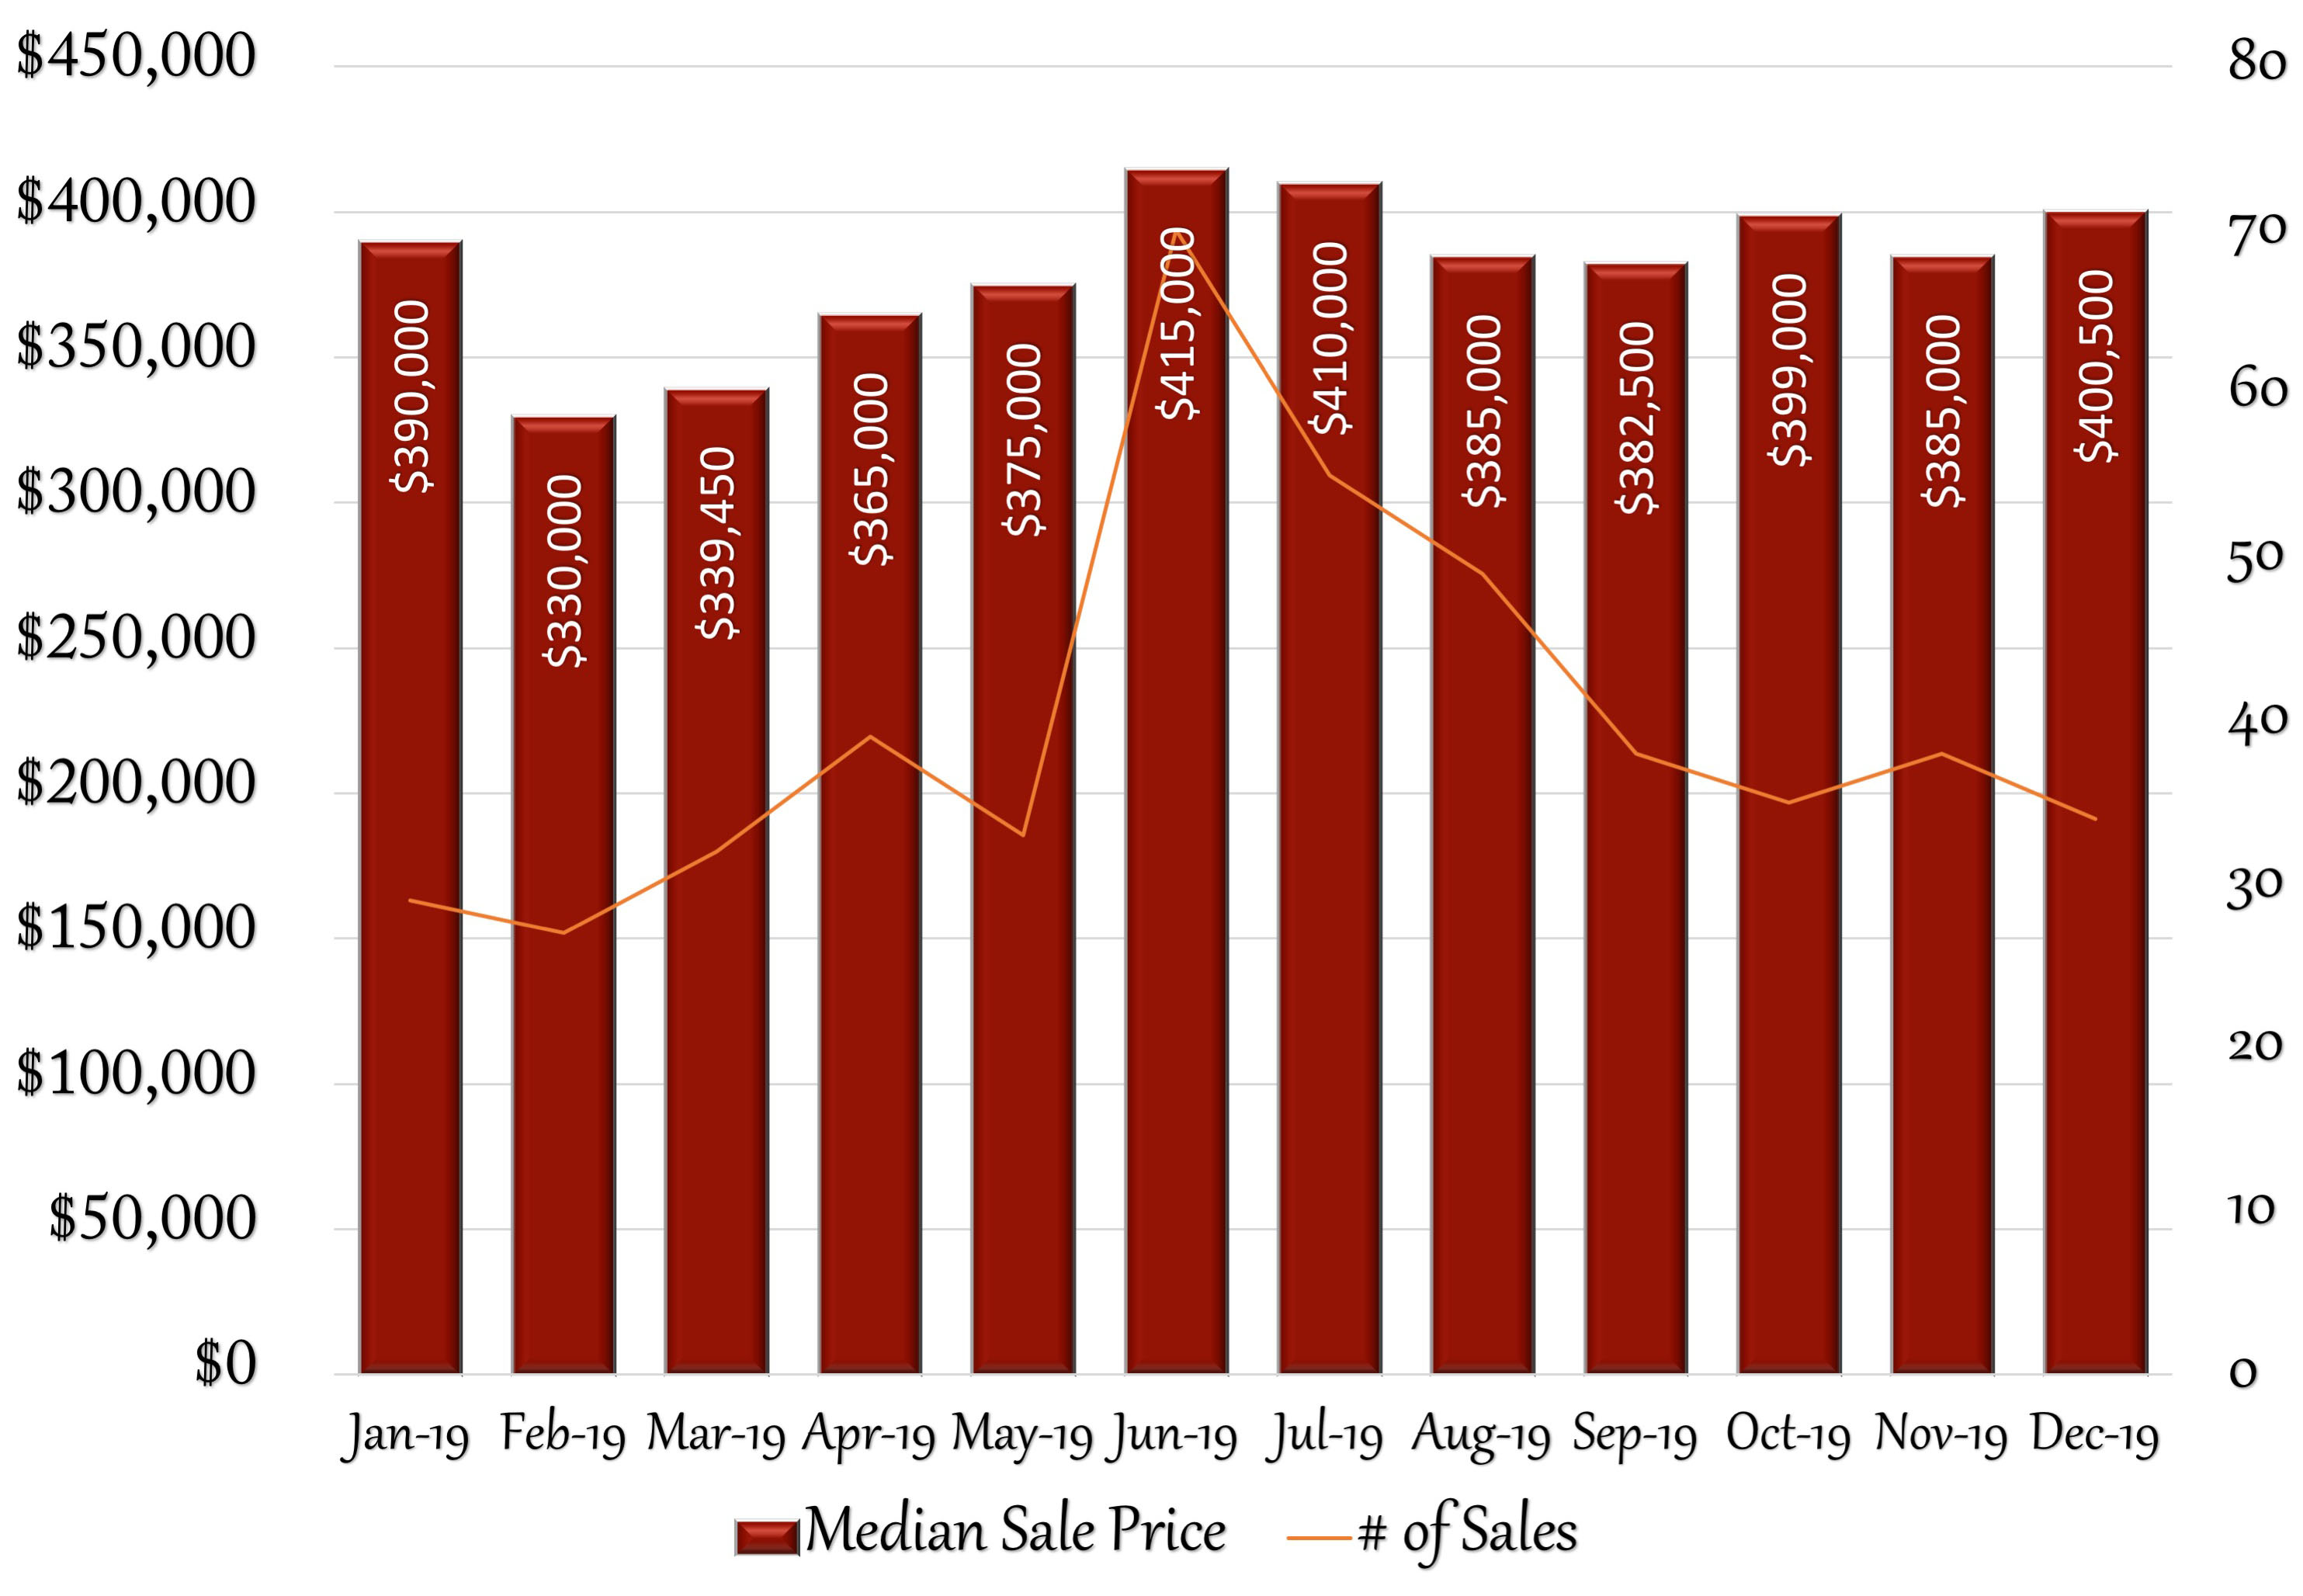
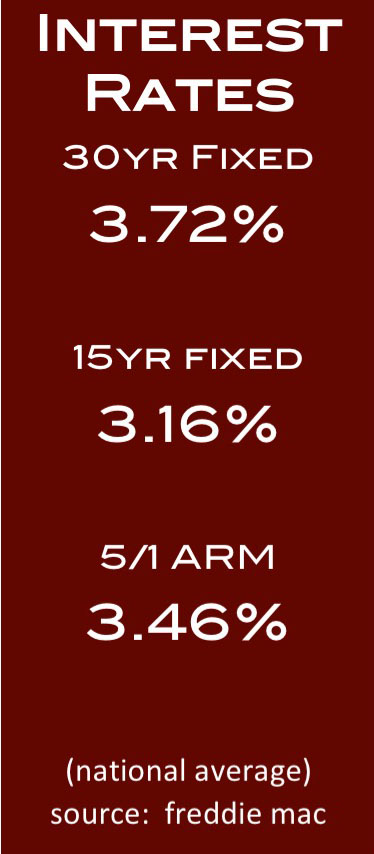
Trumbull’s real estate market remained consistent with the previous several months. The median sales price ticked up to $400,500 on 34 sales, similar to October’s median of $400,00 on 35 sales. Since January, it has risen by 2.69%, yet remained fairly stable since June’s high of $415,000. The days on market has also remained consistent, rising only by 4 days; November 61 days, December 64 days. The 2.7 months of supply indicate a seller’s market. With low inventory compared to the number of sales, serious buyers may not be able to shop around as much as they may like. Several months of low interest rates continue favor buyers ready to commit. At 3.72% for a 30yr fixed rate at the end of December, rates have not been above 4% since April. Homeowners with higher interest rates may also benefit by refinancing. If you have any questions, or if you know anyone who is thinking of buying or selling real estate, I’d be happy to speak with you.
12 Month Sales Activity
Housing Stats
(change from previous month)
| Median Sale Price: | $400,500 |
| change: | 4.03% |
| YTD change: | 2.69% |
| Units Sold: | 34 |
| change: | -10.53% |
| Active Listings: | 105 |
| change: | -21.64% |
| New Listings: | 22 |
| change: | -47.62% |
| Days on Market: | 64 |
| change: | 4.92% |
| Months of Supply: | 2.70 (Seller's Market) |
| change: | -25.00% |
December Single-Family Home Sales
(OLP: original list price • LP: list price • SP: sale price • DOM: days on market)
| Address | Style | sq ft | BR | BA (f/h) | OLP | LP | SP | SP/OLP | DOM |
| 29 Pauline St. | Cape Cod, Colonial | 1,142 | 3 | 1/0 | $244,900 | $244,900 | $235,000 | 96% | 71 |
| 82 Sturbridge Lane | Colonial | 2,008 | 4 | 2/1 | $275,000 | $275,000 | $265,600 | 97% | 50 |
| 2157 Huntington Tpke. | Colonial | 3,144 | 4 | 3/1 | $1,100,000 | $950,000 | $855,000 | 78% | 887 |
| 385 Unity Rd. | Cape Cod, Colonial | 1,690 | 3 | 2/0 | $299,000 | $299,000 | $300,000 | 100% | 53 |
| 36 Chestnut Hill Rd. | Colonial | 2,188 | 3 | 1/1 | $395,000 | $395,000 | $401,000 | 102% | 72 |
| 41 Aragon Dr. | Ranch | 1,652 | 3 | 2/0 | $410,000 | $390,000 | $350,000 | 85% | 86 |
| 55 Midland Rd. | Colonial | 2,597 | 4 | 2/1 | $509,900 | $489,900 | $470,000 | 92% | 44 |
| 60 Hilltop Dr. | Colonial | 1,840 | 3 | 1/1 | $469,000 | $469,000 | $450,000 | 96% | 8 |
| 10 Essex Lane | Colonial | 2,330 | 4 | 2/1 | $469,900 | $469,900 | $450,000 | 96% | 37 |
| 424 Church Hill Rd. | Colonial | 2,910 | 4 | 1/1 | $379,900 | $379,900 | $379,900 | 100% | 31 |
| 2213 Huntington Tpke. | Colonial | 3,000 | 4 | 2/1 | $729,900 | $699,900 | $680,000 | 93% | 62 |
| 5199 Main St. | Cape Cod | 1,908 | 4 | 1/1 | $279,900 | $279,900 | $265,000 | 95% | 160 |
| 58 Rocky Hill Rd. | Ranch | 1,209 | 2 | 1/0 | $269,900 | $269,900 | $277,000 | 103% | 29 |
| 4 Moorland Rd. | Cape Cod | 1,553 | 2 | 1/1 | $359,900 | $325,000 | $315,000 | 88% | 75 |
| 10 Winhall Lane | Colonial | 3,199 | 3 | 2/2 | $639,900 | $639,900 | $625,000 | 98% | 54 |
| 26 Smith Dr. | Ranch | 2,065 | 3 | 1/0 | $269,900 | $269,900 | $255,000 | 94% | 48 |
| 102 Woolsley Ave. | Ranch | 1,690 | 3 | 2/0 | $419,900 | $419,900 | $419,000 | 100% | 119 |
| 38 Russ Rd. | Colonial | 4,261 | 4 | 3/1 | $599,000 | $599,000 | $580,000 | 97% | 25 |
| 54 Raven Rd. | Ranch | 1,300 | 3 | 2/1 | $279,900 | $279,900 | $269,900 | 96% | 53 |
| 9 Irving Rd. | Split Level | 1,667 | 3 | 1/1 | $315,000 | $315,000 | $298,000 | 95% | 32 |
| 43 Woodcrest Ave. | Ranch | 1,850 | 3 | 1/1 | $359,900 | $339,500 | $329,000 | 91% | 116 |
| 14 Lull Water Rd. | Raised Ranch | 1,914 | 4 | 3/0 | $419,900 | $419,900 | $400,000 | 95% | 93 |
| 54 Normandy Rd. | Colonial | 2,896 | 3 | 2/1 | $524,990 | $499,990 | $485,000 | 92% | 95 |
| 44 Lorma Ave. | Ranch | 2,109 | 3 | 2/0 | $379,000 | $379,000 | $370,000 | 98% | 51 |
| 50 Chestnut Hill Rd. | Cape Cod | 1,571 | 3 | 3/0 | $369,000 | $369,000 | $350,000 | 95% | 60 |
| 19 Gaylord Rd. | Ranch | 2,928 | 4 | 2/0 | $384,500 | $384,500 | $380,000 | 99% | 4 |
| 84 Kent Lane | Ranch | 1,566 | 3 | 2/0 | $379,900 | $354,900 | $340,000 | 89% | 154 |
| 10 Thomas St. | Cape Cod, Contemporary | 6,818 | 5 | 2/1 | $519,500 | $490,000 | $475,000 | 91% | 115 |
| 90 Roosevelt Dr. | Raised Ranch | 2,468 | 5 | 2/1 | $410,000 | $410,000 | $413,850 | 101% | 65 |
| 115 Cranbury Dr. | Contemporary | 3,783 | 4 | 3/1 | $519,900 | $519,900 | $500,000 | 96% | 89 |
| 41 Brewster Place | Colonial | 2,510 | 3 | 2/1 | $525,000 | $525,000 | $515,000 | 98% | 98 |
| 50 Middlebrooks Ave. | Cape Cod, Ranch | 2,878 | 3 | 3/0 | $465,000 | $450,000 | $475,000 | 102% | 46 |
| 246 Lawrence Rd. | Split Level | 2,090 | 3 | 2/1 | $429,900 | $429,900 | $420,000 | 98% | 73 |
| 15 August Lane | Colonial | 2,915 | 4 | 2/1 | $559,500 | $514,900 | $495,000 | 88% | 239 |
| Units Sold: 34 | $410,000 | $402,500 | $400,500 | 96% | 64 |
Sales Trends: January-December
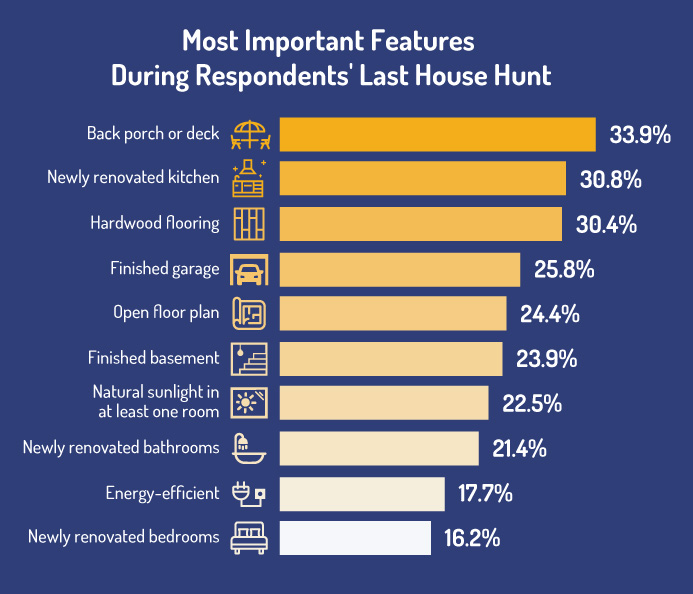
Most In-Demand Home Features:
Curious about which home features are most important to buyers? A recent survey by Porch.com reveals that the number 1 most sought-after home feature amongst buyers is a back porch or deck. Close 2nd and 3rd were a newly renovated kitchen and hardwood flooring. The ever-popular open-floor plan came in at a surprisingly 5th on the list trailing behind a finished garage. Other desired features included a finished basement, natural light, newly renovated bathrooms, energy efficiency and newly renovated bedrooms. The back porch or deck was the number one feature for baby boomers, generation x and millennials alike. On average, buyers were willing to pay between an additional $2,532 – $4,570 more than their budget for homes with the features they most desired.